
Digital Advertising Insights · Audience Insights · Lucy Greider · November 2026
Campaign Season by the Numbers: Inside 2026 Midterms Ad Spend
As the 2026 US midterms approach, read about the top-spending political advertisers, and how their strategy differed across creatives, politicians, and parties.
As we approach the 2026 midterms, political ads are nearly inescapable. Sensor Tower analyzed US political ad spend from Sep. 1 to Oct. 20, 2026, focusing on which parties and candidates are spending the most on various channels, how strategy diverges across top contenders, and, importantly, who’s actually seeing these ads.
The Season’s Priciest Ad Targets James Talarico
The most expensive political ad released this campaign season — and also the most-viewed — attacks Texas Democratic Senate candidate James Talarico. His race against the state’s Attorney General, Ken Paxton, has been one of the most closely-watched toss-ups in the country. The 30-second video spot opens with “Miriam”, Texas mom of five, speaking to the camera about claims regarding Talarico’s positions on gender transition for minors. On October 10th, it received 18.5 million impressions in one day.
This ad, along with 53 other creatives released since September 1st, was paid for by Texas PAC — the fourth-highest-spending political advertiser in the runup to this year’s midterms. The target of the ad, James Talarico’s campaign (“Talarico for Texas”) happens to be the second-highest spender on that same list.
Attack Ads Dominate The Landscape
Of the ten ads with the highest budgets behind them, five were placed by Republican-aligned advertisers, and four by groups in favor of Democrats (with the final ad advocating for a California ballot measure that would essentially veto a billionaire wealth tax). Theme-wise, emotionally salient and politically fraught topics are common, including the aforementioned transition care for children, references to Jeffrey Epstein, and sex trafficking more generally. Five of the ten most expensive creatives are attack ads, including each of the top three.

Beneath each ad creative, you can see the total number of impressions it received from Sep 1 - Oct 20, as well as the primary channel it appeared on.
Also of note is that while many creatives focused on toss-up races, some were dedicated to battles that appear far less competitive (such as incumbent Kathy Hochul’s gubernatorial campaign in New York. As of writing, Hochul leads her opponent in the polls by ~14 points). An ad supporting California gubernatorial candidate, Xavier Becerra, is the most expensive non-attack ad on the list, and an endorsement of Prop 42 is the only policy ad.
A Crowded Field at the Top
The top ten advertisers by spend had the exact same partisan split as the top creatives: five Republican, four Democratic, and one policy-focused (“No on Prop 40”). In a crowded field, the number one spender, WinSenate, only outspent the #10 advertiser by around 1.7X. Geography tells some of the story. The Lone Star State accounts for three of the top ten advertisers (Talarico, Texas PAC, Greg Abbott) while Georgia claims two (Rick Jackson, a Republican running for Governor, and Jon Ossoff, a Democratic incumbent running for Senate). All ten of the high-spenders ran creatives on Facebook, Instagram, YouTube, OTT, and Linear TV, while five utilized Snapchat, three spent on X, and only one (Talarico) put budget into Desktop Display.
The outlier: the campaign for Michigan Senate candidate Abdul El-Sayed is the only advertiser to appear in the top-ten by impressions without appearing in the top-ten by spend. His campaign ads received ~15% more impressions than did Texas PAC, while using just over half (~56%) the budget. This is at least partly explained by El-Sayed’s strategy of putting a whopping ~94% of ad funds into Meta’s Facebook and Instagram, where impressions typically cost far less than traditional channels like Linear TV, on which Texas PAC placed large investments.
Where the Money Went
Compared to all advertisers who spent money from Sep. 1 to Oct. 20, political advertisers overindexed on YouTube (+18 percentage points higher than average), and Linear TV (+15 pp), while underindexing on Facebook (-11 pp) — which makes El-Sayed’s Meta-heavy strategy somewhat of an outlier.
Political advertisers decided to ramp up their spending significantly on certain channels heading into campaign season. Most notably, Snapchat saw a 935% period-over-period increase — possibly a youth-targeted play — while Desktop Video enjoyed 753% gains, and ChatGPT, despite accounting for a small portion of overall funds (about $18k), saw investment increase 592%.
Who’s Seeing the Ads
The average person who viewed a political ad in September 2026 is an upper-middle class 35-year-old. In general, younger audiences are overrepresented compared to the US population, as are those with an income in the 60th to 80th percentile. Men and women are exposed about equally to political advertisements.
If someone has viewed a political ad, they are nearly 82X more likely than the general public to have seen an ad by Americans for Prosperity, a Koch-backed conservative libertarian group. Other political advertisers with outsized visibility among political ad viewers include:
50.29X: American Federation of State, County, and Municipal Employees (AFSCME) — the largest public service employees union, which typically backs Democrats
37.54X: WinSenate — a Democratic super PAC
36.02X: Turning Point USA — a conservative nonprofit organization
34.09X: Abdul El-Sayed for Michigan
25.44X: Rock the Vote — nonpartisan nonprofit dedicated to registering young voters
Notably, half of these aren’t campaigns at all; they’re advocacy groups, a union, and a voter registration nonprofit.
Texas offers an interesting contrast in ad targeting strategies between Talarico’s and Paxton’s campaigns. People exposed to an ad from “Talarico for Texas” were, on average, four years younger with a lower average income percentile (63rd vs. 74th) than those exposed to a “Ken Paxton Campaign” advertisement. The latter group was also more likely to be male (64% vs 56%).
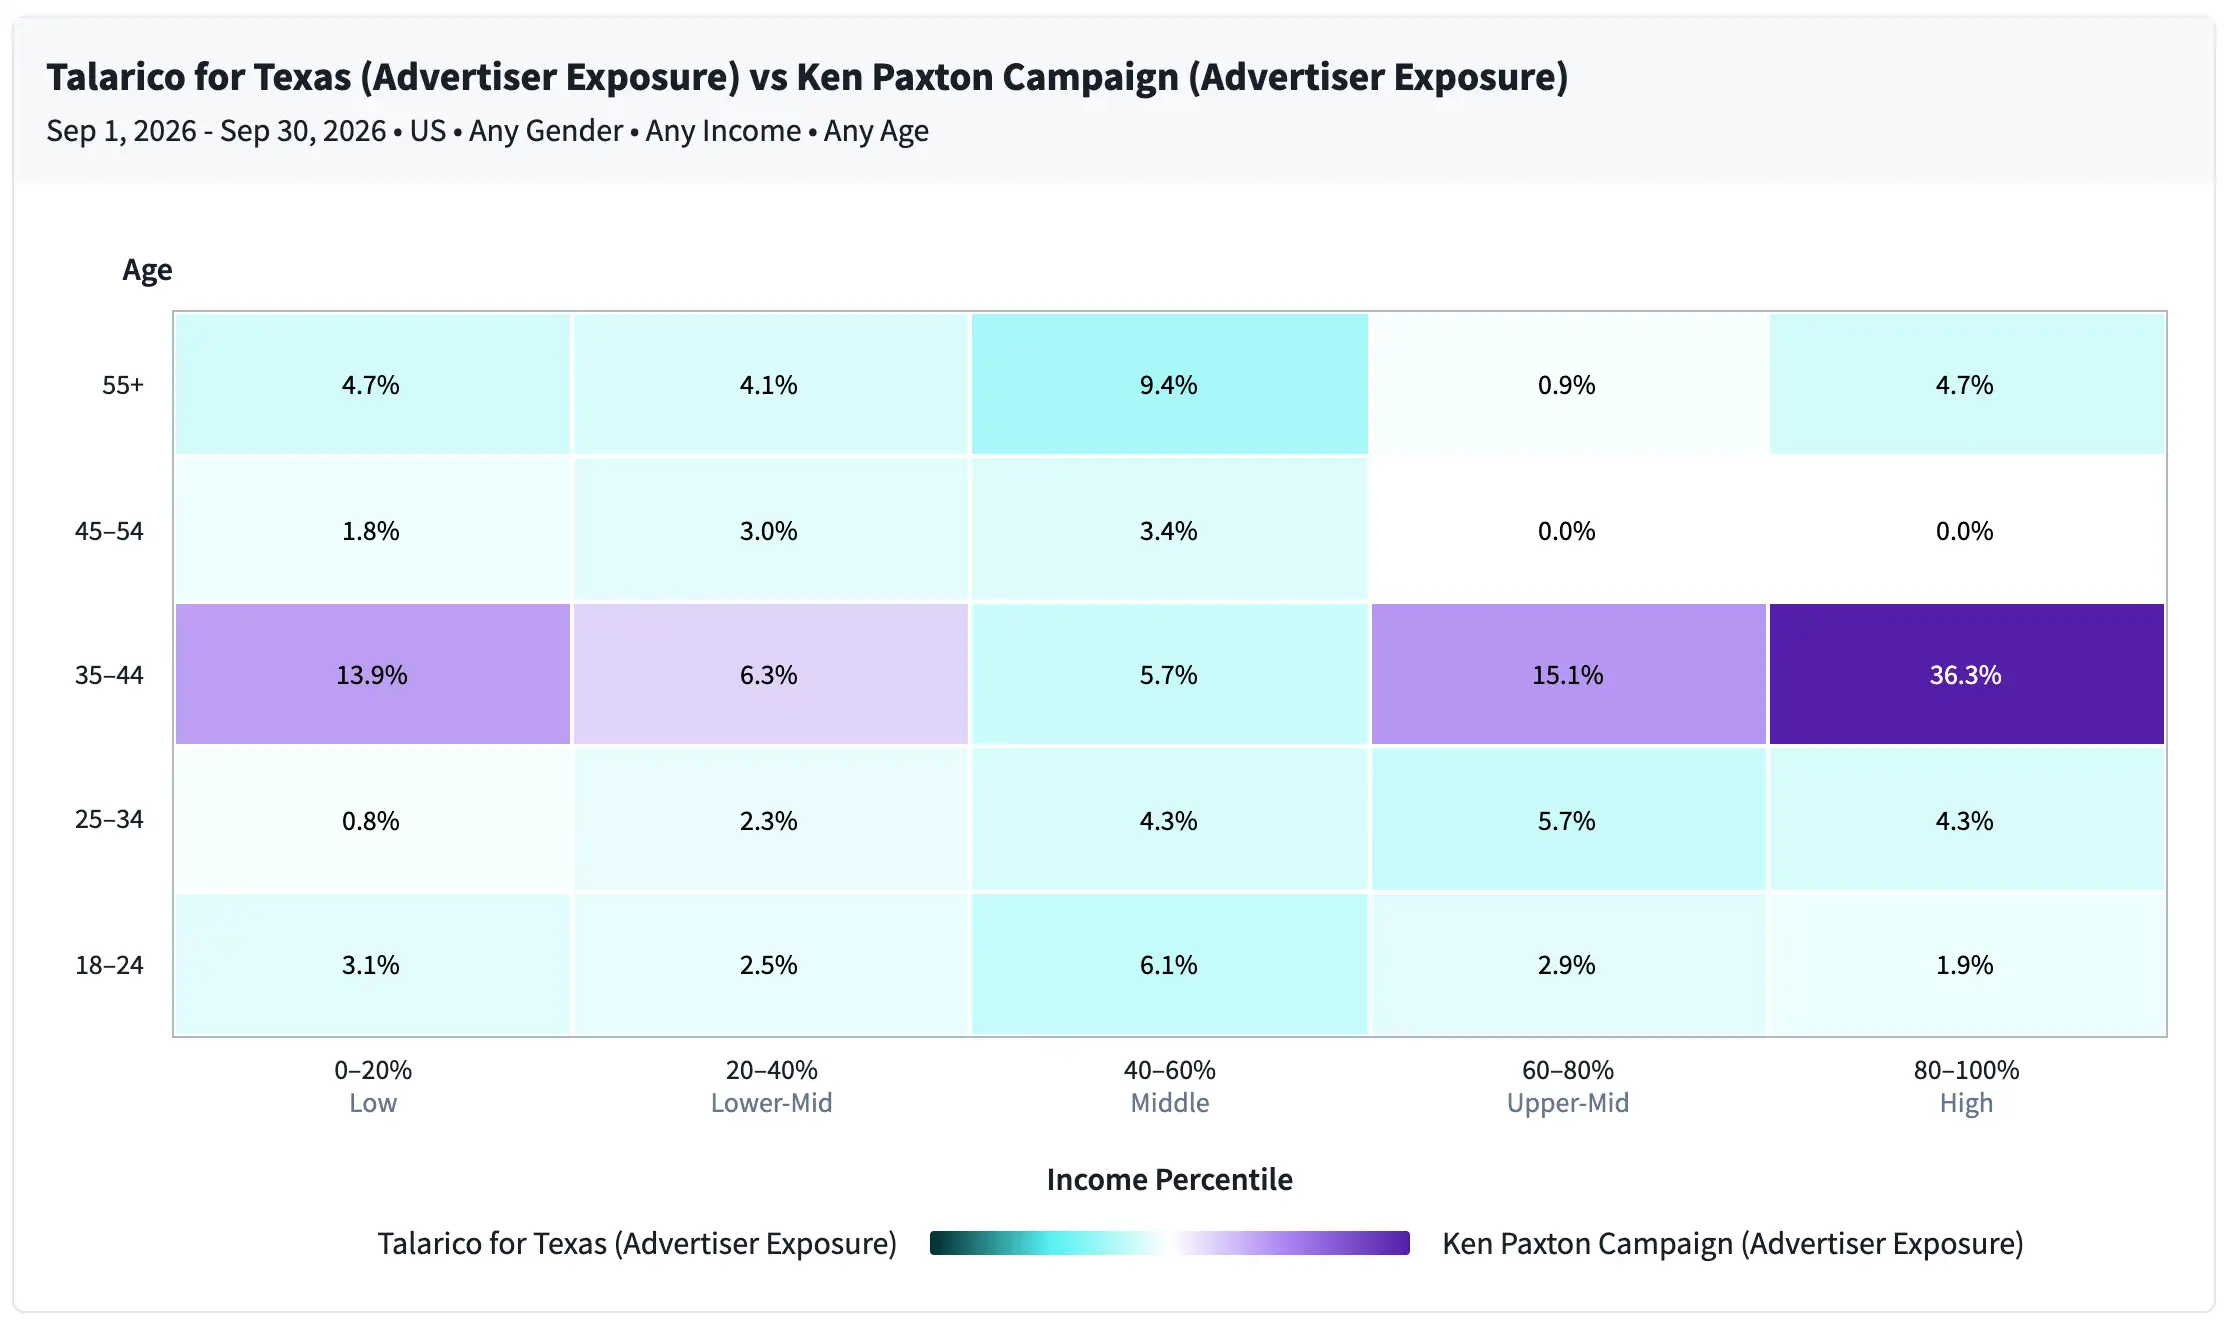
This heatmap shows the relative exposure various audience segments had to Talarico's and Paxton's campaigns. For example, high-income 35-44 year-olds were 36% more likely to have been exposed to a Paxton ad than to one for Talarico.
With the elections nearly upon us, the money is concentrated in TV, YouTube, and a handful of battleground states like Texas. In the past couple months, millions of Americans have viewed ads from politicians across the political spectrum: they see them while they’re scrolling social media, watching Netflix, surfing the web. Soon, we’ll know just how persuasive these marketing campaigns have been. Stay tuned for more insights from Sensor Tower on the most pressing current events in the headlines and in our culture.
