

AI Insights · Timothy · April 2023
Top 5 MMORPG Apps Performance in Luxembourg for Q1 2023
An overview of the performance of the top 5 MMORPG applications on a unified platform in Luxembourg during the first quarter of 2023, based on data from Sensor Tower.
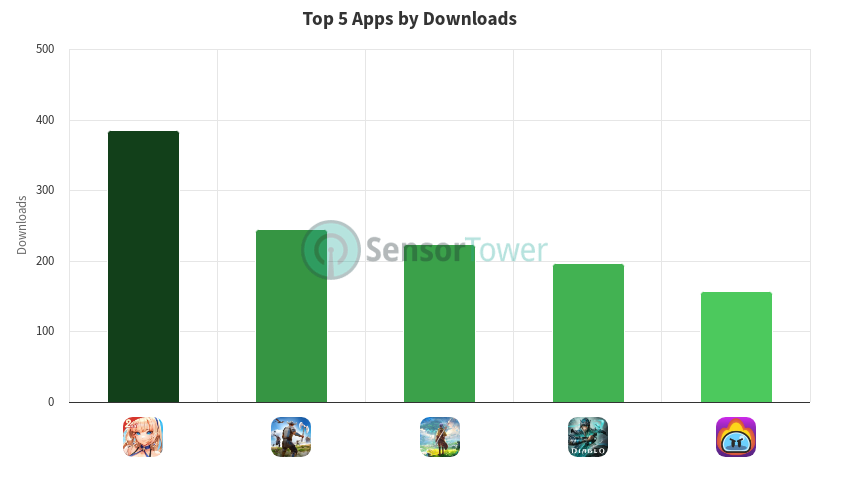
In the first quarter of 2023, the top 5 MMORPG applications on a unified platform in Luxembourg demonstrated varied performance metrics in terms of weekly downloads, revenue, and active users. Here is a detailed breakdown of their performance:
Summoners War: Chronicles The app saw a fluctuation in weekly downloads, starting at 158 in early March and dropping to 30 by the end of the month. The weekly revenue experienced an upward trend, peaking at around $208 in mid-March before settling at $132. Weekly active users showed a slight variation, starting at 123 and peaking at 152 mid-month, before dropping back to 116.
Evil Lands: MMO RPG This game had a modest performance in terms of downloads, beginning the quarter with 35 downloads and ending with 12 in late March. Revenue remained negligible throughout the quarter, with a minor spike to $9 at the end of March. Active users showed a declining trend from 58 at the start of the quarter to 0 by the end of February, with occasional fluctuations in between.
The Legend of Neverland The Legend of Neverland experienced a notable increase in weekly revenue, peaking at $341 in mid-March. Downloads remained relatively low, fluctuating between 8 and 28 throughout the quarter. Active users saw a decline from 127 at the end of December to 79 by the end of March, with slight increases in mid-January and mid-March.
Diablo Immortal Diablo Immortal showed strong revenue numbers, starting the quarter at $1.2K and peaking at $1.2K again in the final week of March. Downloads remained low, with a peak of 45 in mid-January and a drop to 5 in early March. Active users demonstrated a gradual decline from 318 at the end of December to 254 by the end of March.
Slime Quest: Dungeon Adventure This app saw minimal revenue, with a peak of only $9 in mid-January. Downloads fluctuated slightly, starting at 14 in late December and dropping to 4 by the end of March. Active users showed some variation, peaking at 43 in mid-March but generally remaining low throughout the quarter.
These insights are based on data from Sensor Tower, which provides a detailed analysis of app performance metrics. For more in-depth insights, you can visit Sensor Tower.