
Web Insights · News and Announcements · Lucy Greider · August 2026
Data Drop: 4 New Web Insights Reports & How To Use Them
Let's walk you through four new Web Insights reports, and what they can do for your brand: Web Overlap, Path Journey, Conversion Rate, and Search Keywords.
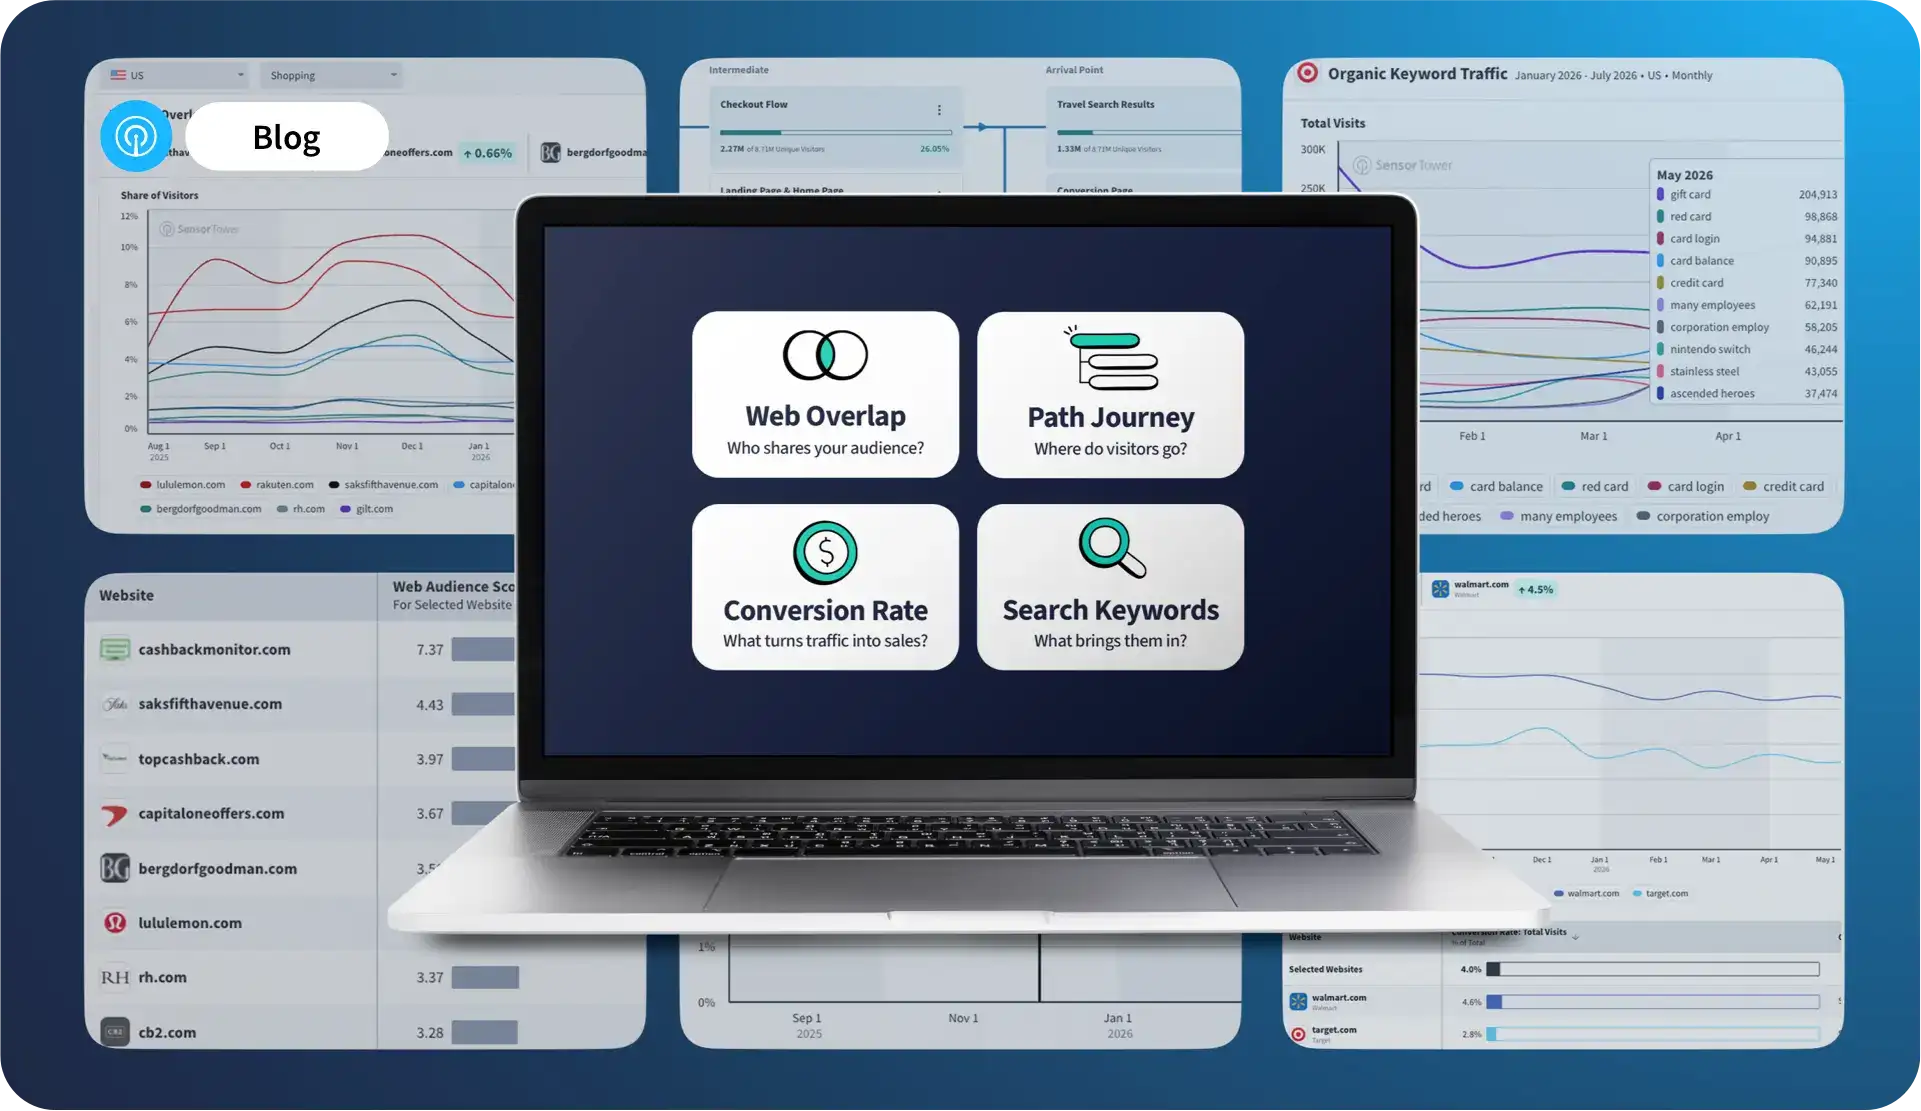
We’ve just added four brand new reports to Web Insights, giving clients an even more robust understanding of the competitive arena. Together, they answer four questions that matter most to anyone trying to boost revenue and engagement online:
Which sites are competing for the same users?
Which organic search terms lead people to your site?
Which landing pages are most likely to convert a visitor into a customer?
And how do people actually move through your site once they land?
To show you these reports in action, we’ll walk through each one using Gap.com as a case study throughout.
1. Web Overlap
Web Overlap shows you the audience overlap among users of various sites. For instance, as you can see in the below report, 15% of Gap.com visitors also visited JCrew.com (April 2026). Above the graph, you can also view the directionality of the overlap. For example, the portion of Gap visitors navigating to Madewell’s site has decreased slightly since January 2026.
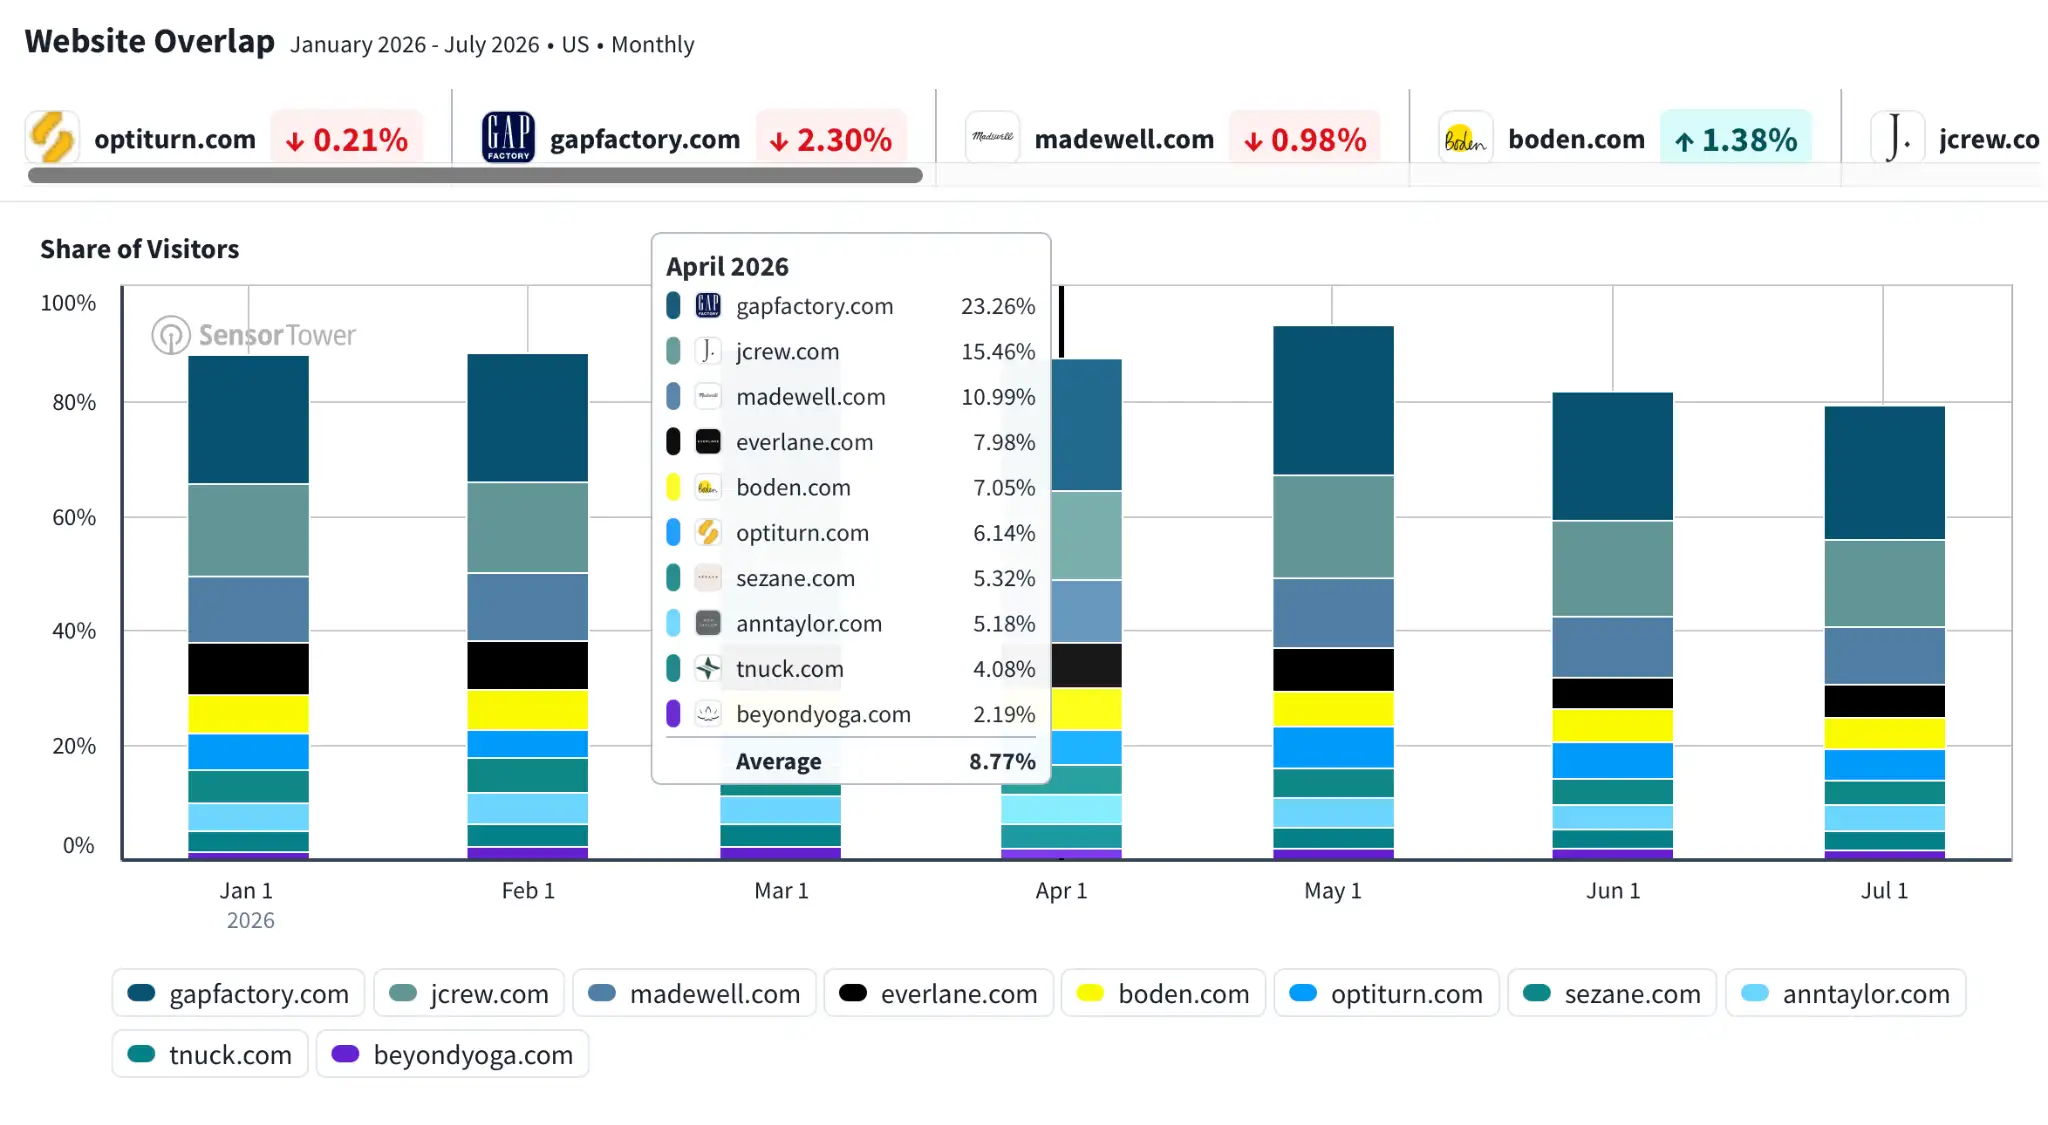
This tool is useful for identifying emerging threats to market share, new opportunities for partnerships, and the product interest displayed by your target audience.
2. Path Journey
Building on the insights available in our Paths report, we’ve now added Path Journey. Take a more granular look at the journey users take on your site, with navigation data three clicks deep. Users can explore the journey both by exact URL paths and by path categories (e.g., "Cart → Checkout → Order Confirmation"), making it easy to see drop-off points across a user's browsing session. For instance, in the below chart, you can see that 3.49% of visitors to Gap’s Product Listings pages navigated directly to the Shopping Cart afterwards.
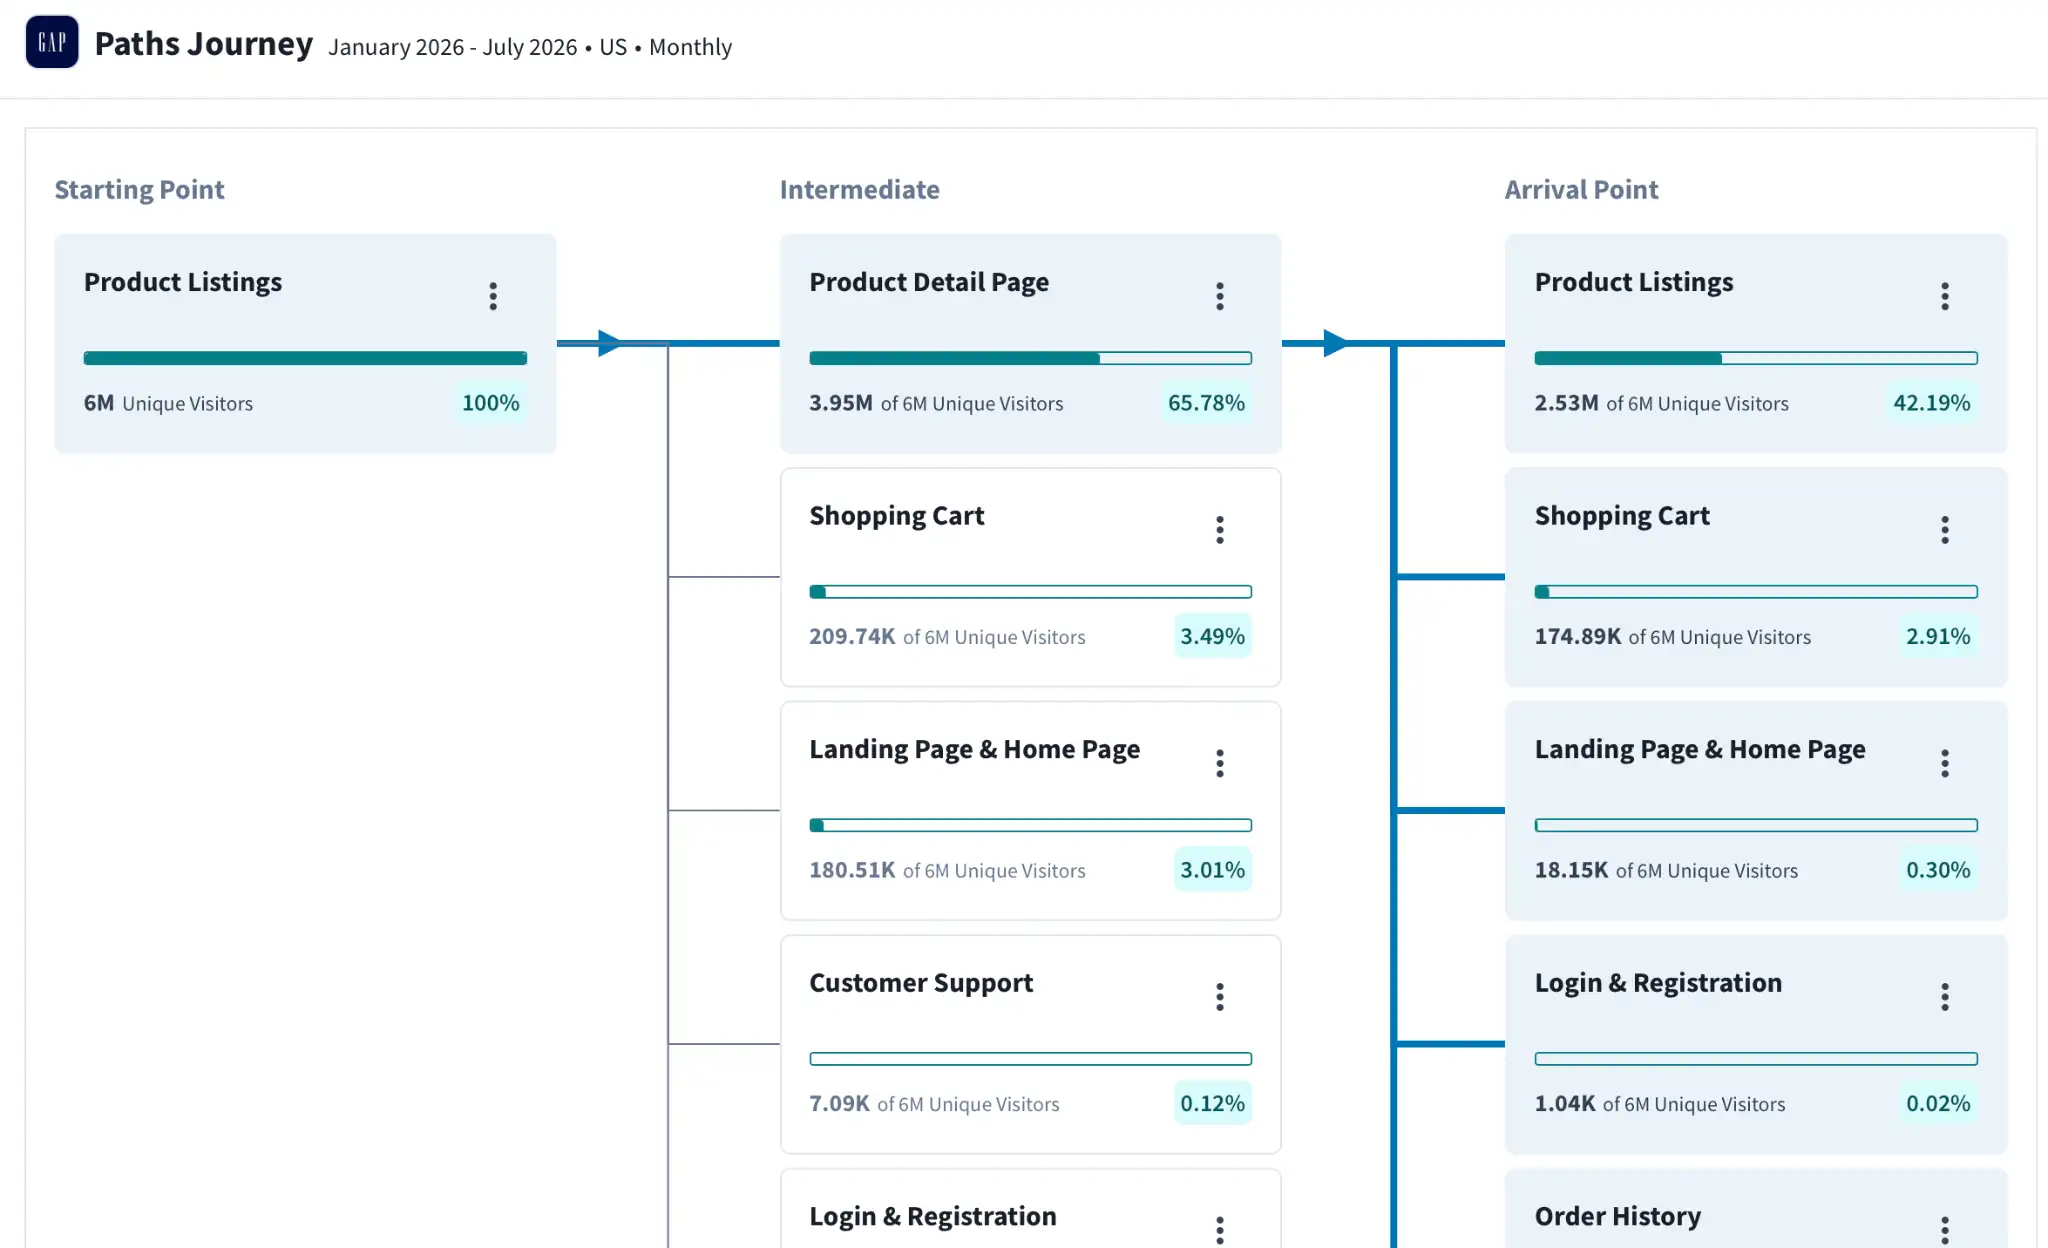
Gain deeper visibility into the traffic flow on your site, and the landing pages most likely to lead to conversions. Understand at what stages users drop off, and then untangle the reasoning behind it.
3. Conversion Rate
Our Conversion Rate report gets to the heart of what ecommerce brands value most: sales. This report is perfect for brands benchmarking their own conversion efficiency against competitors, investors using CVR as a monetization health signal, and any analyst who wants a single-number pulse on how well a site is monetizing its traffic. The report shows you the number of users that landed on a conversion page (a confirmation in the form of a receipt or “thank you” message) as a fraction of total site visits — giving you a real-time proxy for the portion of customers making purchases.
4. Search Keywords
Finally, with our new Search Keywords tool, you can determine exactly which organic keywords lead to real visibility for sites across verticals; not just what they’re searching, but what’s actually leading them to you. Use it to inform your own content strategy, gauge customer demand, and shape organic content that will move the needle on visibility.
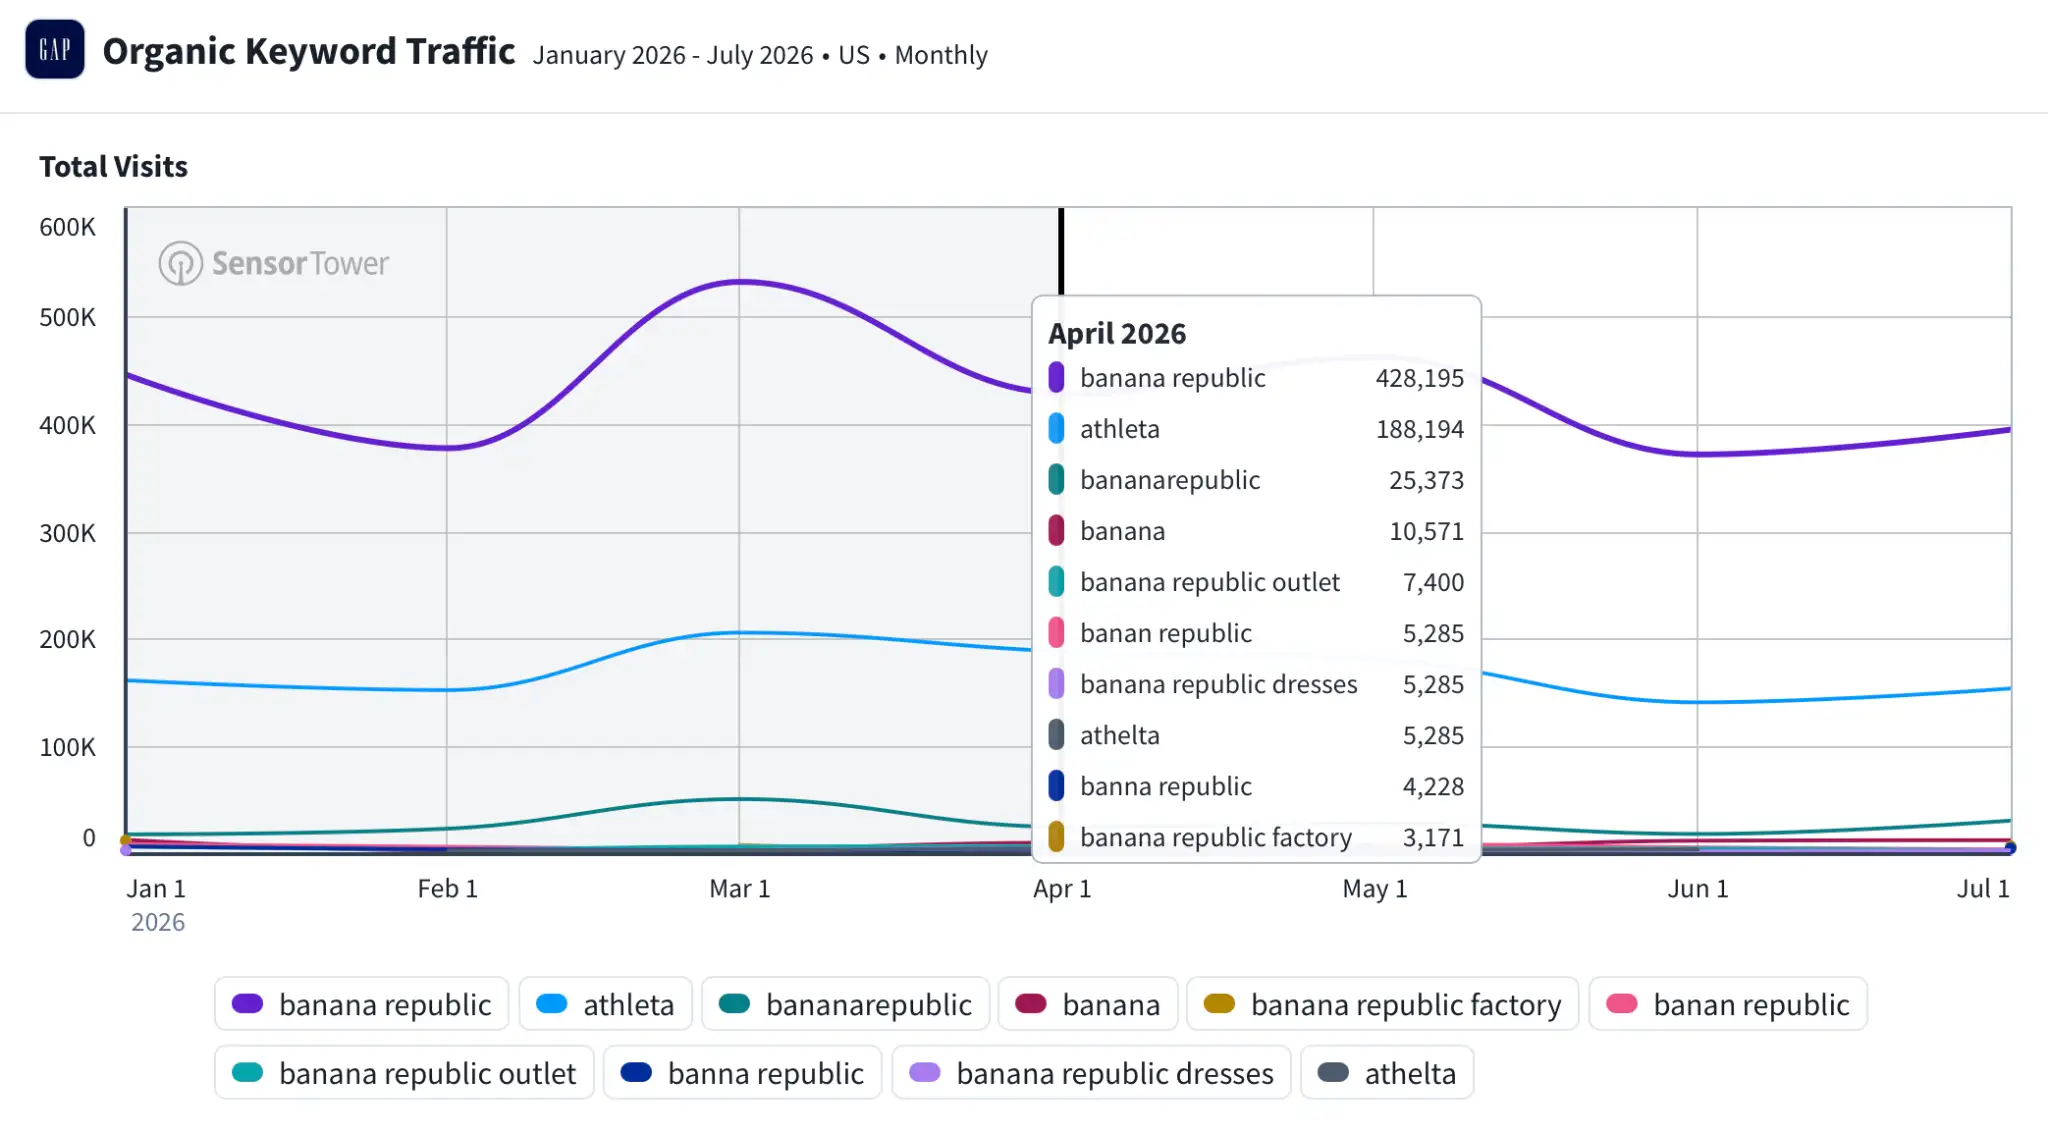
In this report for Gap, we see that the keyword banana republic led to over 400,000 visits to Gap.com in April.
As new gaps open in the market, technology evolves, and customers provide feedback, Sensor Tower makes it our mission to constantly stay abreast of a data landscape constantly in-flux. Together, these four new reports move Web Insights from merely sizing an audience, to truly explaining the heart of performance — and pointing to what’s next.

Written by: Lucy Greider, Manager of Digital and Content Marketing
Date: August 2026