
Digital Advertising Insights · Audience Insights · Mobile App Insights · Lucy Greider · August 2026
Income Brackets, Heatmaps, & More: What's New In Audience Insights
Sensor Tower's demographics data just got a major revamp. Audience Insights now gives you access to income data across thousands of consumers, sharpening your ability to create targeted campaigns and break through the noise. But that's not all: you can now compare audience segments side-by-side, in sleek new reports such as our heatmap view. Get the full scoop below.
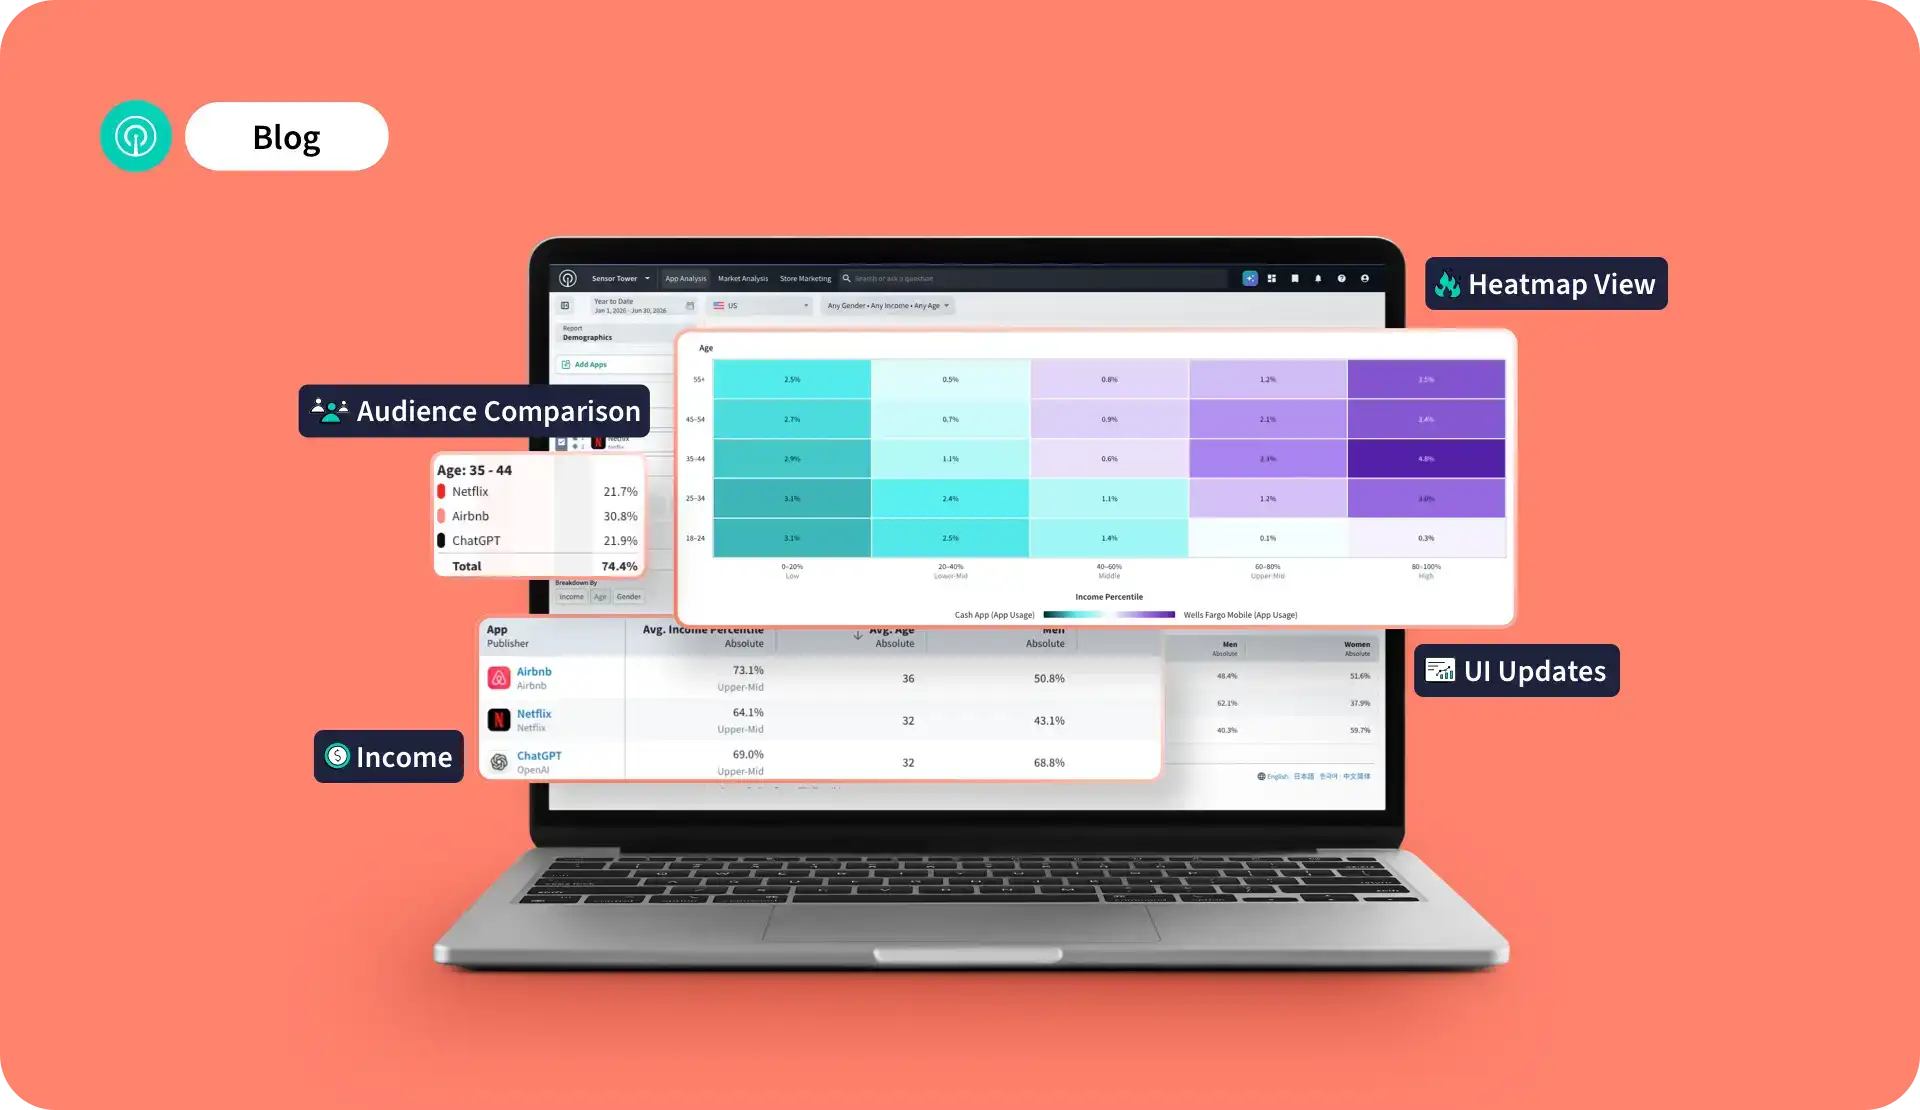
Our demographic insights just leveled up. Here’s what’s new, and how to use it.
One of the greatest advantages of digital marketing is the ability to target specialized audience segments. A billboard on the side of the road reaches a lot of people, but it’s broad and unwieldy in its focus. A targeted digital ad? Here is where you can drill down into exactly the groups you want to reach: gamers? Women over 65? People who love pizza and make over $100k?
Audience Insights has always revolved around three core areas of exploration:
→ who the audience is (age, gender, persona)
→ what ads they’re exposed to (top channels, categories, and brands)
→ and what apps they engage with (your competition)
Now we’re adding a fourth: how much they make.
Plus, the ability to compare up to five different audience segments side-by-side, rather than toggling between tabs.
New: Income Percentiles
While age and gender tell you who your audience is, income data tells you what to do about it. That’s why we’ve added income percentiles to our demographics reports. With this Audience Insights-exclusive feature, you can see not just who’s engaging with an app, but their spending power as well. You can use this information to benchmark income distribution across your industry, see how your target demographic’s income compares to competitors, and get a sharper read on whether an audience is worth chasing.
Start by picking the groups you want to size up: the users of a specific app, people exposed to a certain advertiser, or a demographic segment you define yourself.
New: Heatmap Comparison
Our new heatmap visualization adds color to the analysis, making it instantly clear where two audience segments diverge. Say you’re comparing Cash App and Wells Fargo. Instead of scanning two separate tables of age and income data, the heat map shows you at a glance that Cash App’s user base skews younger and lower-income, while Wells Fargo’s leans older and higher-income.
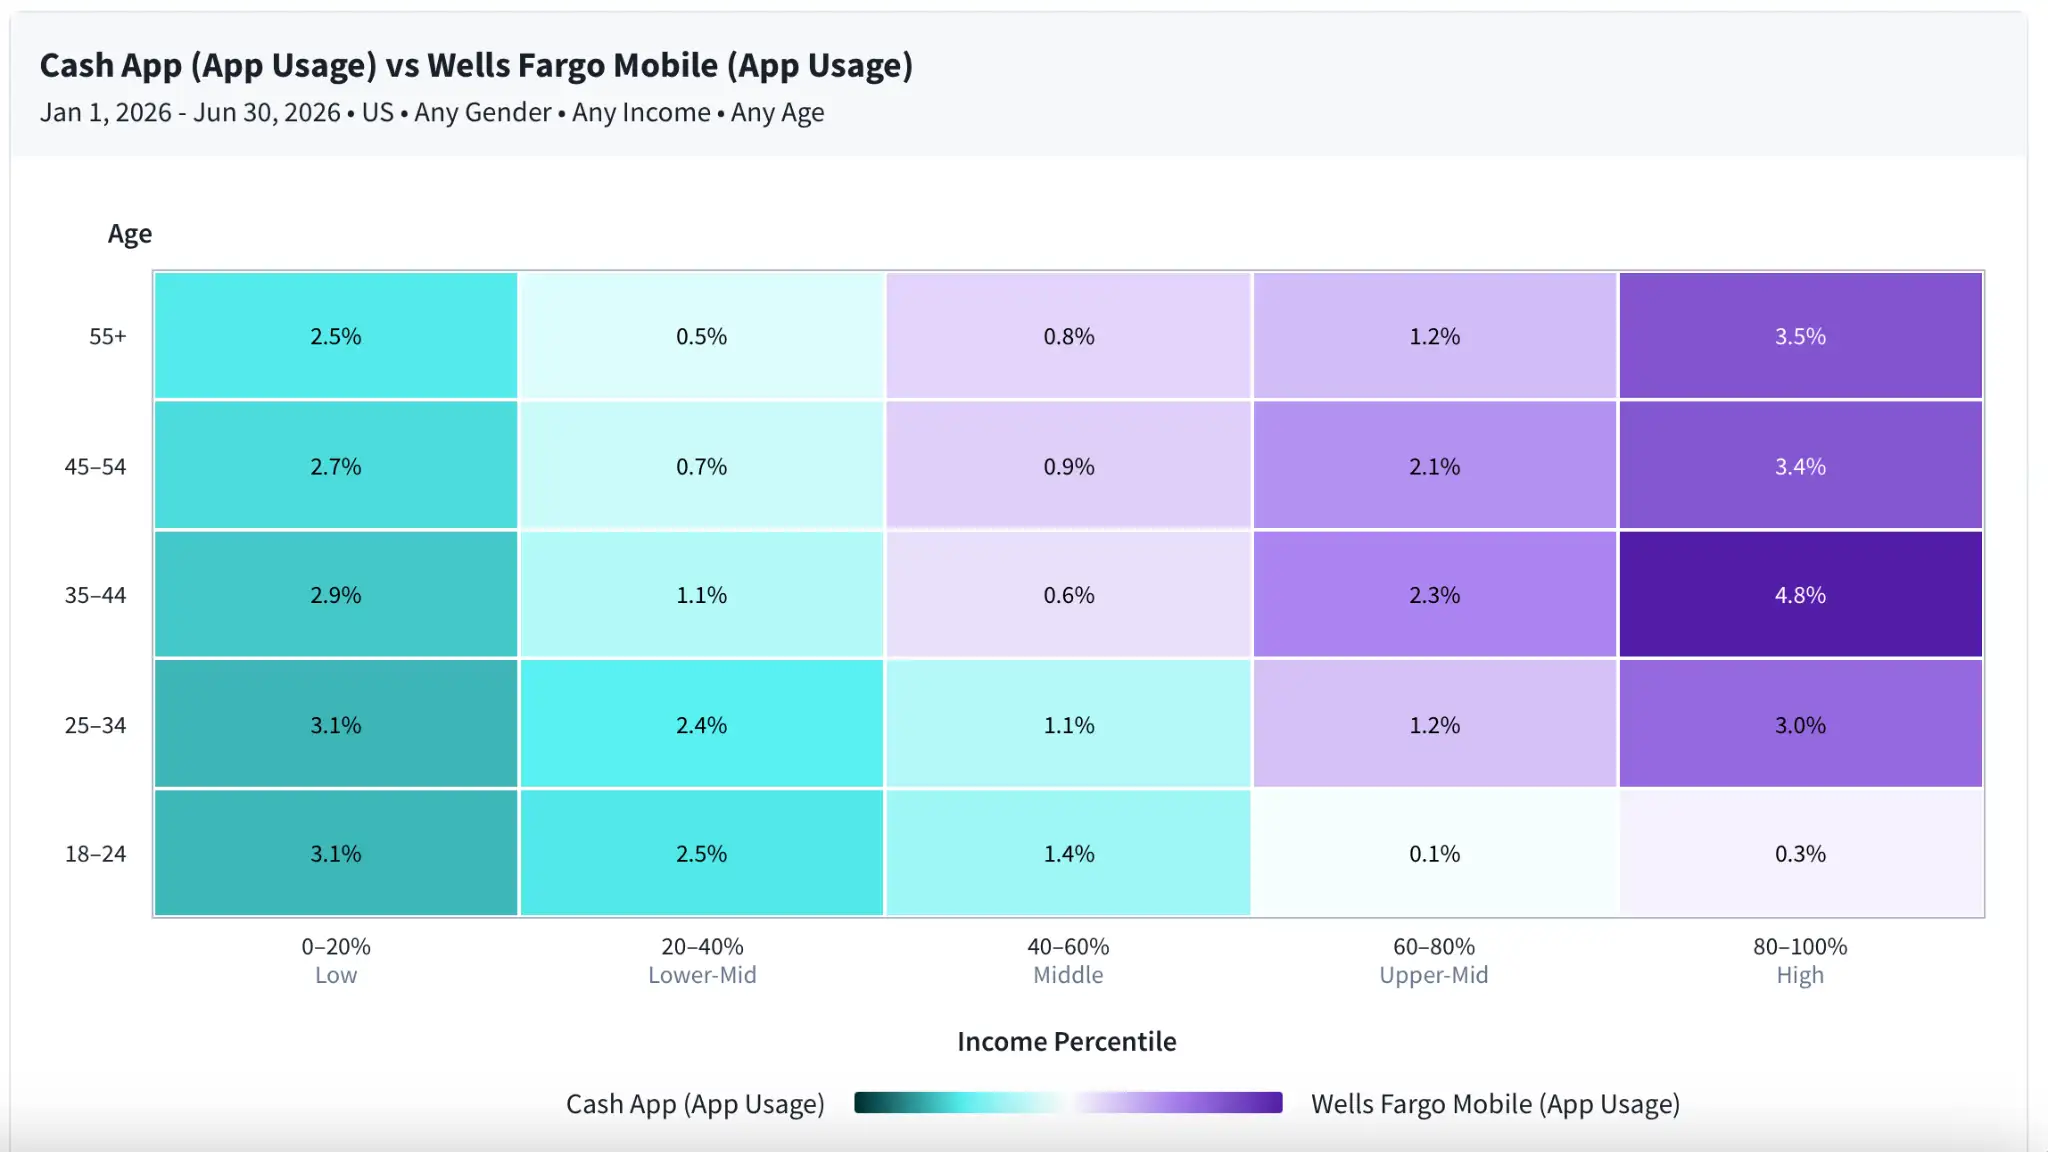
The visual format does the heavy lifting: darker cells show you exactly where each audience concentrates, so you can spot the story in seconds instead of digging for it. More than just a cosmetic change, this is a new way of conceptualizing valuable information.
Comparing More than Two: Full Demographic Breakdowns
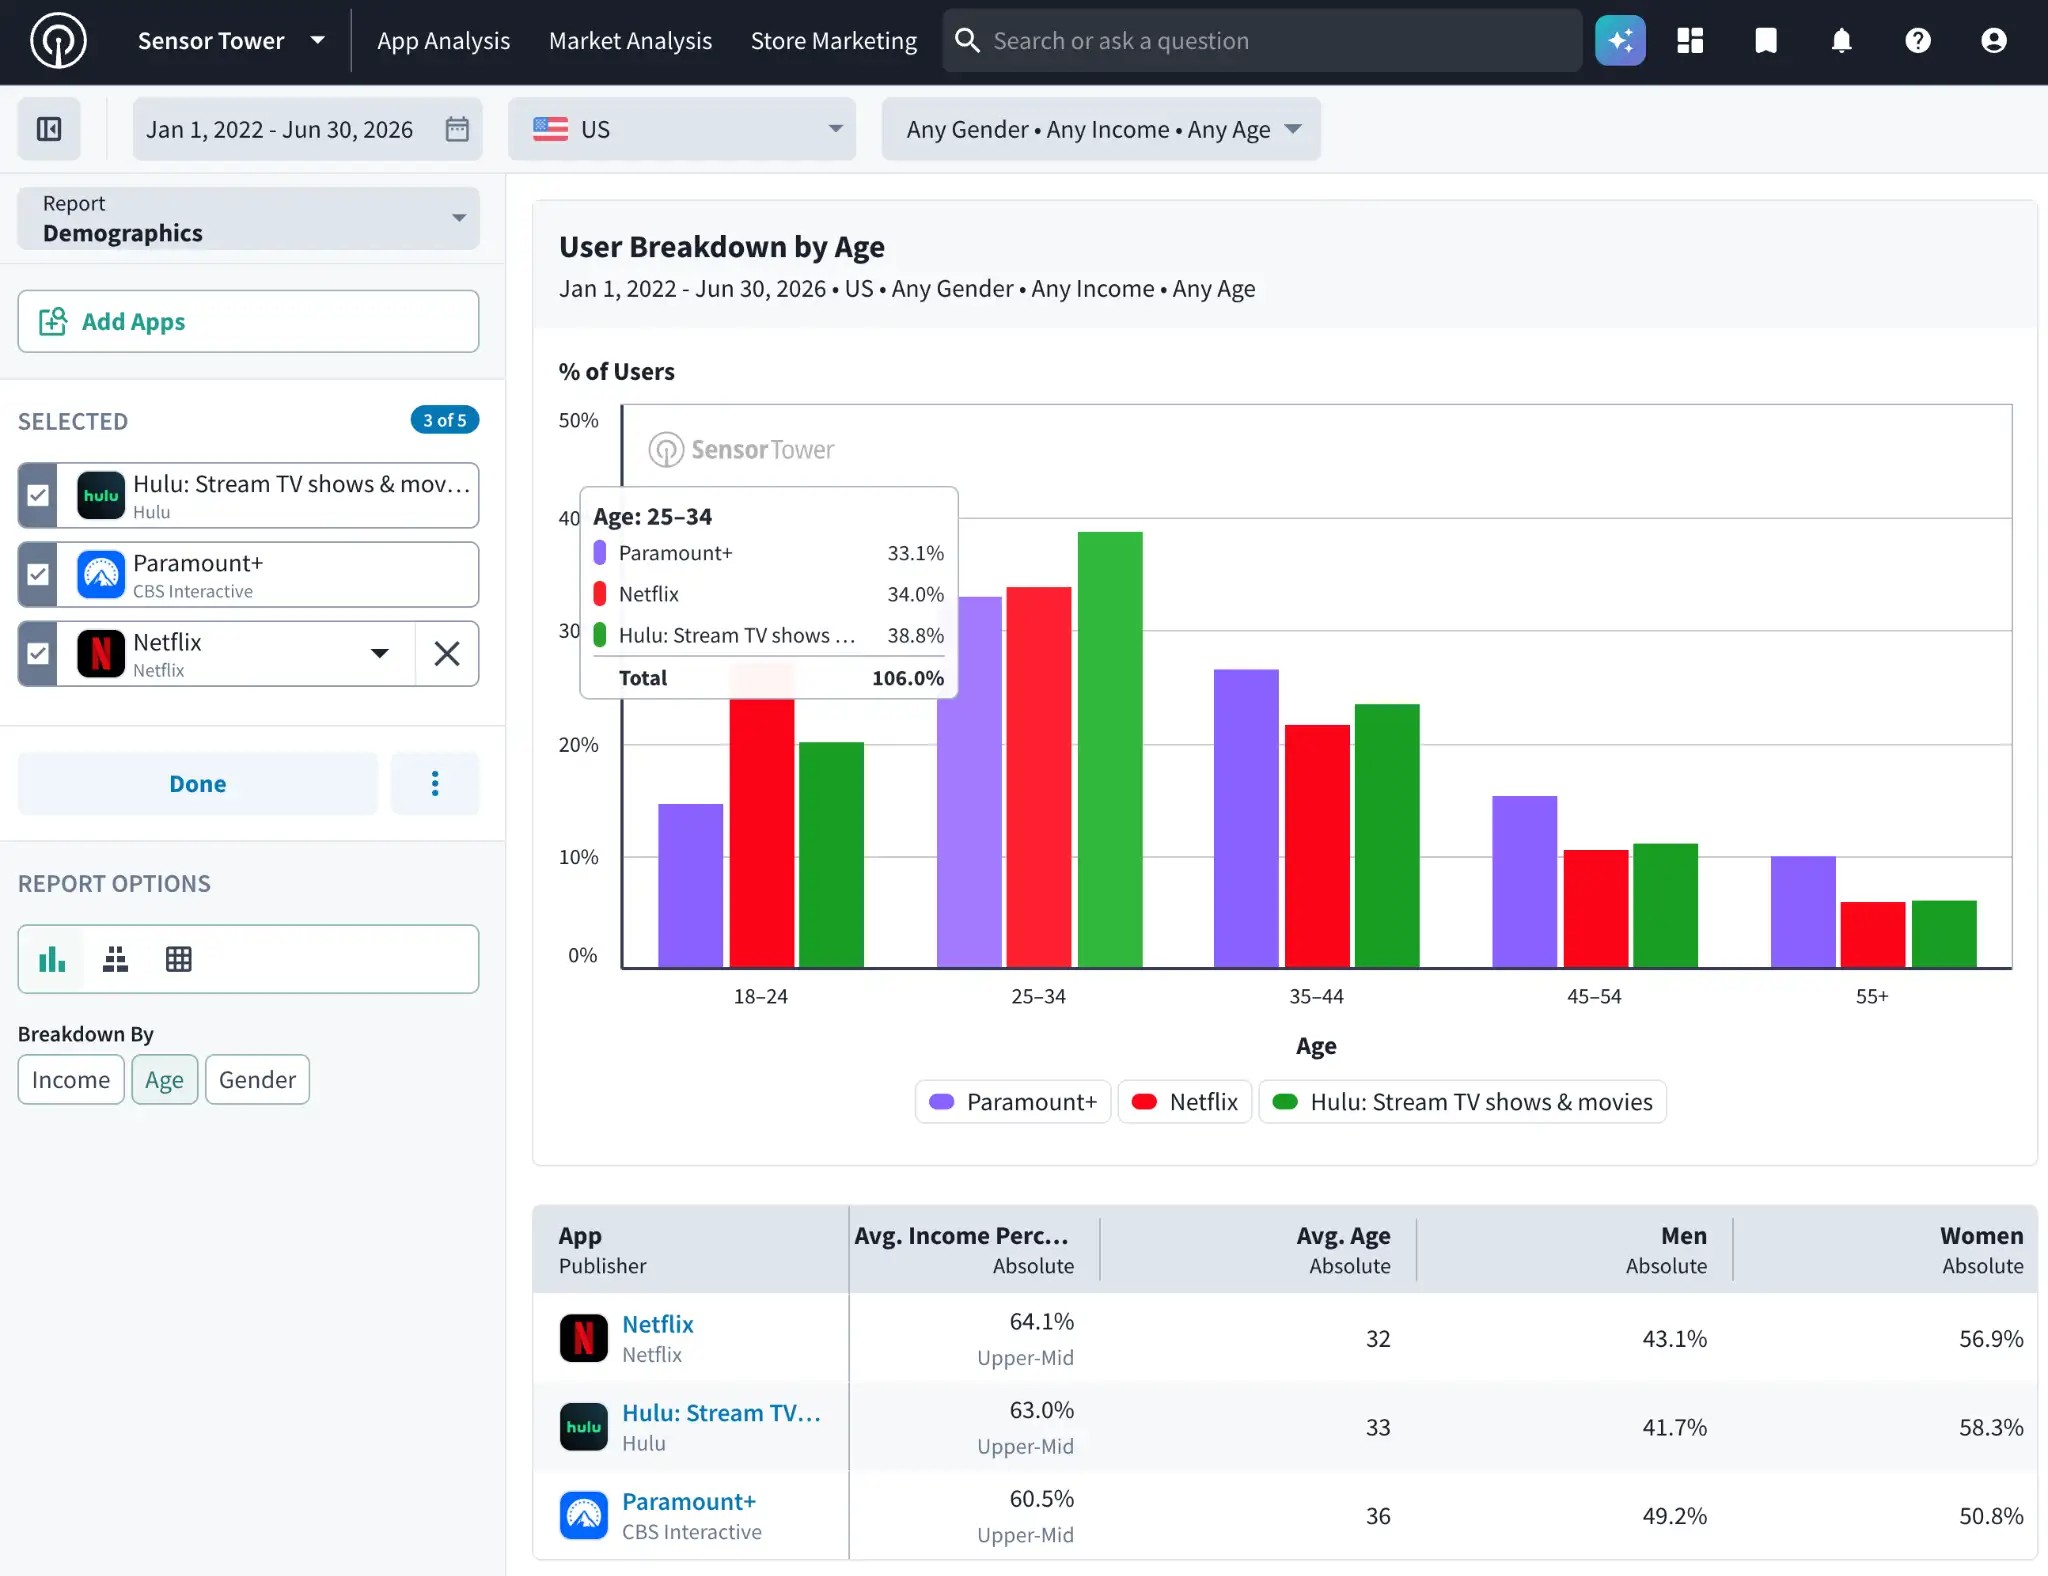
Now imagine you’re an advertiser with limited budget, and you need to decide which platform to invest on for your next campaign. You know your campaigns typically go well on OTT, but you need to reach male audiences between the ages of 35 and 44, as they’re the group that exhibited the most purchase intent in focus groups.
A savvy marketer with access to the Audience Insights platform might select five different top streaming platforms, and compare them by age distribution. You can explore the exact split across, for instance, Netflix, Hulu, and Paramount+. See the average age, income percentile, and gender of each platform’s user base, so you can find out where your ideal customers are congregating, and make the optimal decision for your launch.
Or, you can do it backwards — start with the target demographic (men, 35-44) ,and go from there. See who is advertising to this group, where the majority of their impressions come from, and what personas they align with.
Another popular use case? Product development. Need some ideas for what features your audience would most appreciate? You don’t need to read their journal to get the tea: dive into these insights to learn not only who they are on paper (age, gender, income) but also more qualitative knowledge: Audience Insights Personas reveal what consumers are interested in, how they spend their free time, and how they self-identify. Say you’re an upscale beauty brand. Use the new reports to see who’s advertising to Fashionistas versus, say, Shopaholics. See where their attention is, and which brands are trying to capture it.
The use cases for these new features are truly too numerous to list exhaustively in this blog. At the end of the day, we aren’t giving you anything fancy: it’s good old-fashioned intel, and it cuts to the heart of every advertiser’s north star — their customer base. Name them, reach them, and draw them in.

Written by: Lucy Greider, Manager of Digital and Content Marketing
Date: August 2026