2026 State of Mobile is Live!
Mobile App Insights · Hugh Kimura · September 2014
Why 162,727 Apps Rank In The Top 20 For The Highest Traffic Keywords
Analysis of the apps that rank in the top 20 for the highest traffic on the App Store. Learn why they rank so well.

Our Data Science team has been working hard to uncover App Store Optimization insights that will improve our platform. Stay tuned because we will be adding new features, based on this research. Until then, we want to share some of the data that they have uncovered.
A common mistake in ASO is to only choose the highest traffic keywords. If you have been reading this blog for awhile, then you know that relevance and Difficulty Score are actually more important.
But if you have ever dreamed about having your app rank in the top 10 for a high traffic keyword, there is one question that you have probably asked yourself.
What are the characteristics of apps that rank for the highest traffic keywords?
This post will give you exact statistics on these apps and explain how you can use this information to improve your ASO. Before we dive into our findings, let's take a look at how we got our data.
We sorted all of the keywords in our database by Traffic Score. Then we selected keywords that were in the top 20%. These 14,364 keywords are the most searched keywords on the Apple App Store.
From there, we examined the apps that ranked in the top 20 for each keyword. This resulted in 162,727 unique apps.
Then we averaged several key app characteristics by ranking position. For example, we averaged the ratings for all of the apps that ranked #1, then we averaged the ratings for all the apps that ranked #2, etc.
This will give us insights into the common traits of apps that rank #1, #2, #3, etc. Here is what we discovered...
Average Rating And Ratings Count
Average rating and ratings count are factors that determine search ranking. So what kind of ratings do these top apps have?
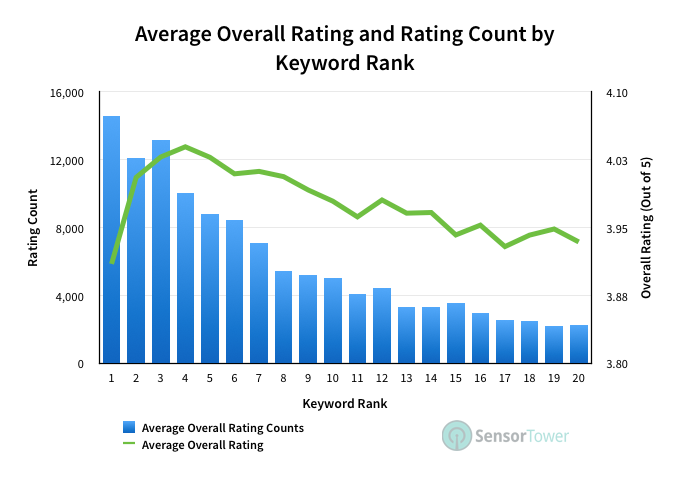
The first graph shows the average rating and ratings count for all versions of the apps in our study.
The number of ratings for apps in the top six positions are significantly higher than for apps in the following 14 positions. This is a clear indication that number of ratings does play a role in App Store search rankings.
Average ratings for these apps fall between 4.1 and 3.9. Interestingly, apps in the #1 position actually have a lower average rating than apps that rank #20. Therefore, we can conclude that falling into an ideal average rating range seems to be more important than having the highest average rating.
This graph shows us that having over 8,000 ratings and an average rating of about 4.0 is ideal.
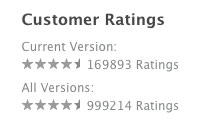
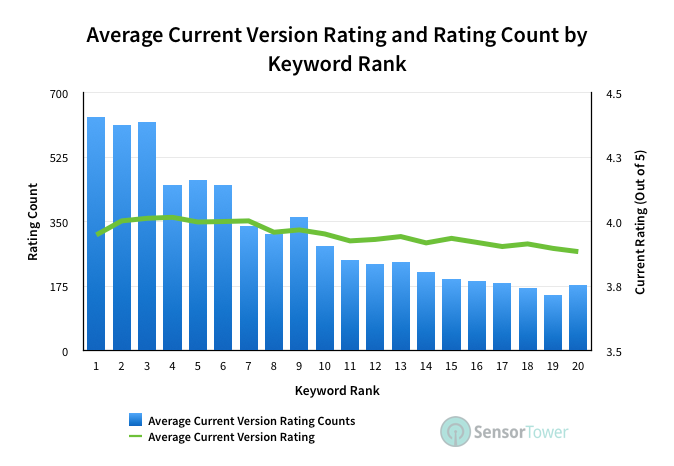
Then we looked at the ratings and ratings count for the current version of each app. As you probably know, the ratings and ratings count that display in search results reset every time an iOS app is updated.
Based on our averages, the ideal ratings count for the most recent version of an app is 350 reviews or more. The average rating is similar to what we saw in the previous graph, with 4.0 being the average across the board.
How You Can Use This Information
This data shows us that the top three positions have a significantly higher number of ratings than apps that are ranked #4 through #20. Therefore, your goal should be to get as many legitimate ratings as possible.
This can be difficult when people are used to ignoring prompts to rate an app. But thinking creatively can pay off when it comes to getting more ratings.
Our data also showed that maintaining an average rating of about 4.0 will give your app a much better chance of ranking well. Creating a quality app and keeping your users happy will give your app the best shot at maintaining a high average rating.
Number Of Days Since First And Most Recent Releases
Next, our Data Science team looked at how long these top ranking apps have been on the App Store since their initial and most recent releases. This could give us clues about how these times affect keyword rankings.
This is no surprise, but the #1 ranked apps also had the longest average time since their first release (blue line). More downloads, a larger install base and more overall reviews are some of the reasons why established apps rank higher in search.
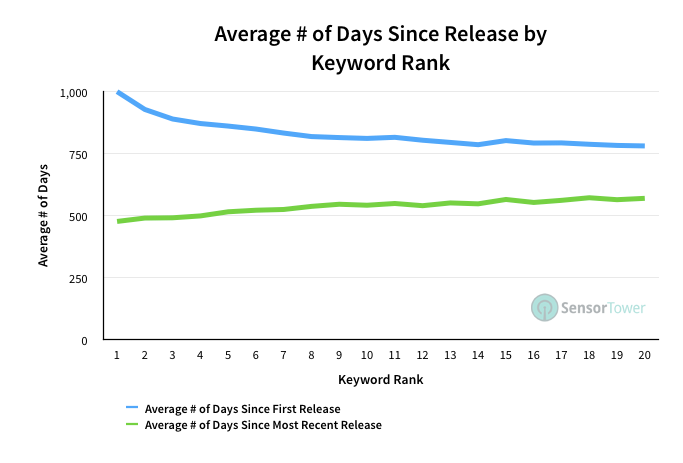
The average number of days since the most recent version release (green line) is also much lower for apps in the #1 position. This is also not a surprise, since more frequent updates usually mean keyword updates, bug fixes and better overall user satisfaction.
However, the number of days since the most recent update might be a little surprising. Apps in the #1 position averaged 476 days since their last update.
You might think that successful apps update more often. But if you consider the fact that these top apps might already be optimized, then the long update time makes sense.
How You Can Use This Information
This data shows that building an app that lasts helps you rank better for your keywords. This usually leads to more reviews, downloads and public awareness.
More frequent updates allow you to do keyword optimization and improve the quality of your app. But at a certain point, your app may become very highly optimized and you may not need to update it as often.
Keywords In Publisher Name, App Name, In-App Purchases And App Description
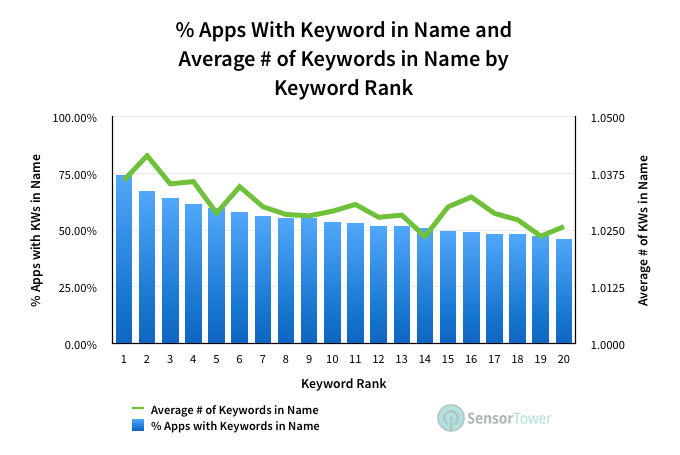
Now let's get into keyword placement and how often these apps have a target keyword in their metadata. The first graph shows the percentage of apps that have the keyword in their app name (green bars).
As we have mentioned before, there is a clear correlation between having a keyword in the name of an app and ranking for that keyword. 74.3% of apps that rank #1 for high traffic keywords have the target keyword in their name.
This graph also shows that some apps have the keyword in their title more than once (blue line). But there is no significant evidence that this is beneficial. In addition, your app could get rejected for keyword spamming if you use a keyword multiple times.
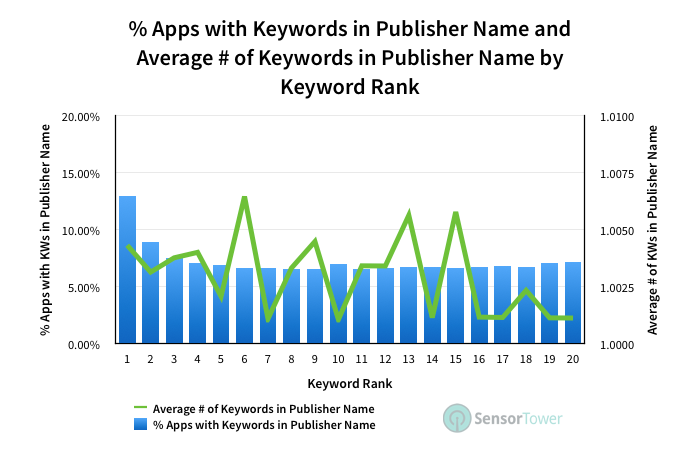
There is some evidence in this next graph that using keywords in the publisher name will help an app rank for a keyword. 12.9% of the #1 apps did have the target keyword in their publisher name. This is almost double the 6.9% average of the other 19 positions.
But even 12.9% is a low occurrence of keywords in the publisher name. This is probably because it is not ideal to optimize the publisher name for target keywords.
Once you set the publisher name, you cannot change it. So you would really have to do your pre-launch research to know which keywords to target.
Even then, if you have multiple apps, this strategy probably won't work for all of your apps. Just like with the previous graph, there are some publishers that include their target keyword in their publisher name more than once. But the results are not significant enough to draw a conclusion as to if this is beneficial or not.
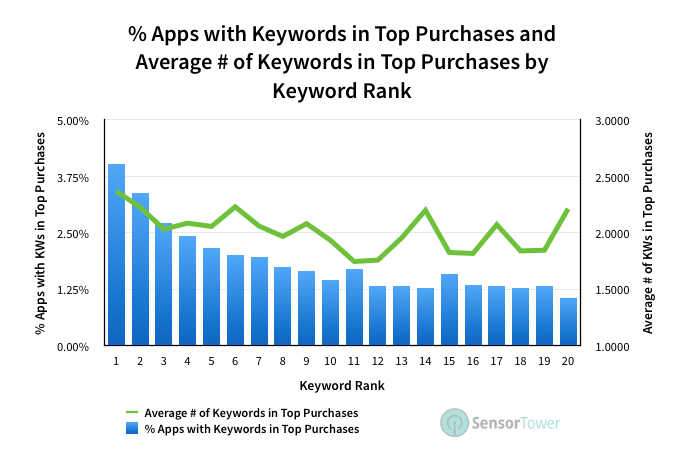
Next, we looked at apps that have the target keyword in the names of their top in-app purchases. There does seem to be some correlation to ranking. But since the percentage of use is so low (4.0% max), it doesn't appear to be a must-use strategy.
What is interesting however, is that the top apps have the target keyword in their top purchases an average of two times. So if you are going to add keywords to your in-app purchase names, inserting it twice appears to help.
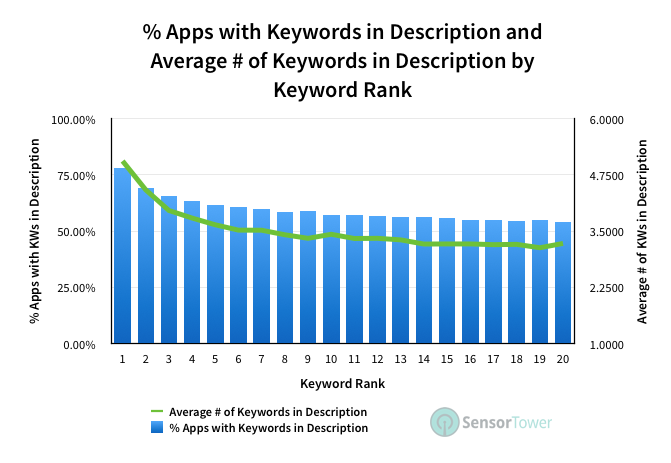
For the final graph in this section, let's look at keywords in the app description. As you probably know, keywords in the description of an iOS app hasn't been known to improve search rankings.
However, this graph shows that 78.1% of all apps with a #1 ranking do have the target keyword in their description. In addition, they use the keyword an average of five times.
This may or may not be one of the reasons that these apps rank so well for their keywords. But it is something to be aware of. We will look into this further and report what we find in a future blog post.
How You Can Use This Information
The bottom line is that keywords in your app name work. But be sure to find the balance between keyword optimization and a brandable name.
Using keywords in your publisher name and the names of your in-app purchases does seem to have a slight positive effect, but not enough to make it mandatory. The lesson here is to add keywords to these names, if it makes sense.
Finally, there is a very high occurrence of keywords in the app descriptions of top ranking apps. This could just be a case of these keywords being vital to the description of the apps and would be included anyway, regardless of ASO value.
Price
How does price affect rankings?
The income of your app can factor into your rankings and top grossing apps appear on the Top Charts. Price can also affect number of downloads and ratings, which in turn, affect rankings.
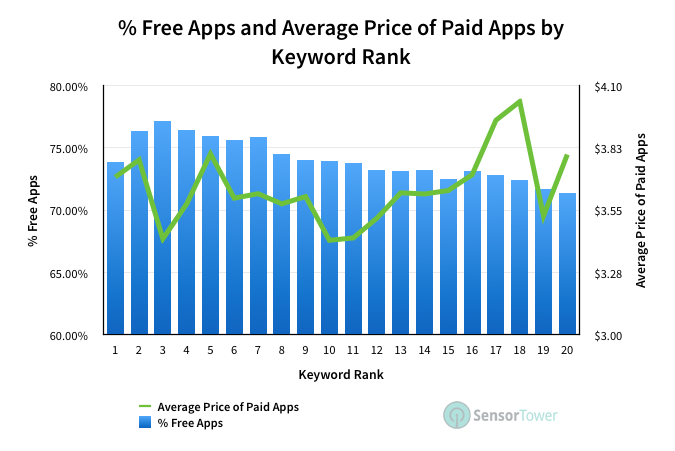
The vast majority of the apps in our study are free. Paid apps are priced less than $4.00, on average.
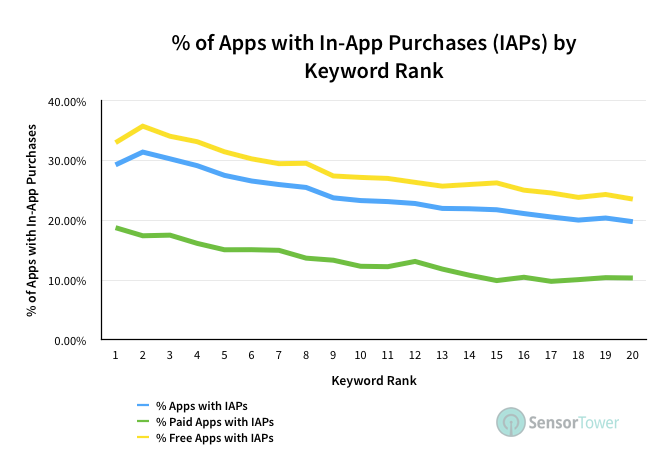
Apps that rank in the top positions have a higher presence of in-app purchases. This applies both paid and free apps.
How You Can Use This Information
So if you are wondering how to price your app, consider making it free with in-app purchases. If you are going to create a paid app, $4.00 or less seems to be the price that most people are willing to pay.
Since this study looks at apps across all categories, you should drill down into your category to find out how publishers are pricing the top apps. This will give you a better idea of what to charge.
Having in-app purchases, regardless if your app is free or paid, does seem to have a positive affect on rankings. Therefore, if your app doesn't currently have in-app purchases, you might consider adding them.
Average File Size
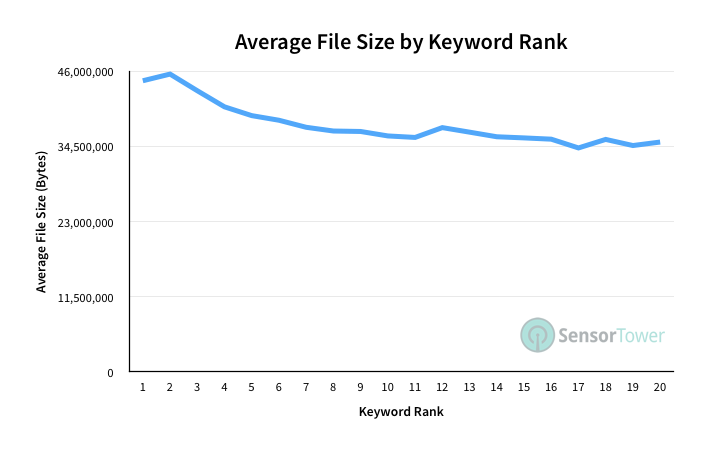
Finally, we want to leave you with an interesting insight with respect to file size. Our Data Science team discovered that the top five positions have an average file size that was approximately 16% larger than the average of apps ranked #6 through #20.
Apps in the #2 position actually averaged the largest file size, about 43.4 MB. Apps ranked in positions #6 to #20 averaged a file size of 35.3 MB.
How You Can Use This Information
This doesn't mean that the App Store ranking algorithm will rank your app higher in search just because it is close to 43.4 MB. But this might be the sweet spot, in terms of maximum file size.
Although Apple has a maximum cellular download limit of 100MB, since these top ranking apps have a much lower average file size, it is obvious that you don't have to get anywhere near this limit to create a successful app.
Apps that are near 100MB also take longer to download, which could also lead to abandoned downloads. So while a slightly higher file size in the top five ranking positions might suggest higher quality apps, biggest is not best.
Conclusion
We hope that you found this information useful. It puts some exact numbers on what we have been blogging about and teach in ASO Academy.
But this is just the beginning. Our Data Science team will be presenting more data in future blog posts.
So be sure to add us to your favorite RSS reader, or follow us on Twitter, Google+ and Facebook.
It is now up to you to implement what you have learned and test, test, test!
If you are looking for another data intensive post, check out our profile of fake app reviewers.
What other data would you be interested in seeing next? Let us know in the comments below...
