2026 State of Mobile is Live!
Mobile App Insights · Randy Nelson · March 2016
U.S. iPhone Users Spent An Average of $33 on Apps in 2015
Sensor Tower Store Intelligence sheds light on the average downloads and spending on America's active iPhones.

Last year, mobile consumers spent an average of $33 on apps—both premium downloads and in-app-purchases (IAPs)—per active iPhone in the United States. In this post, we'll use Sensor Tower Store Intelligence to illustrate how that figure breaks down across the top earning categories per device. Additionally, we'll look at the average number of app installs by category on the iPhones that were active in the U.S. during this period.
About Our Data
The figures in this report are based on active iPhone devices in the United States for calendar year 2015 (January 1 through December 31), as calculated by Sensor Tower. iPhone app download and revenue estimates for the corresponding period were produced by Sensor Tower's Store Intelligence platform.
Note: This analysis has been revised since its original publication based on our latest model of active iPhone handsets in the U.S. for 2015. Additionally, the revenue estimates displayed on the following chart are gross amounts, i.e., the amount spent by consumers on the App Store before Apple's 30 percent cut of revenue has been deducted, and are not inclusive of taxes.
Average Revenue Per Active iPhone

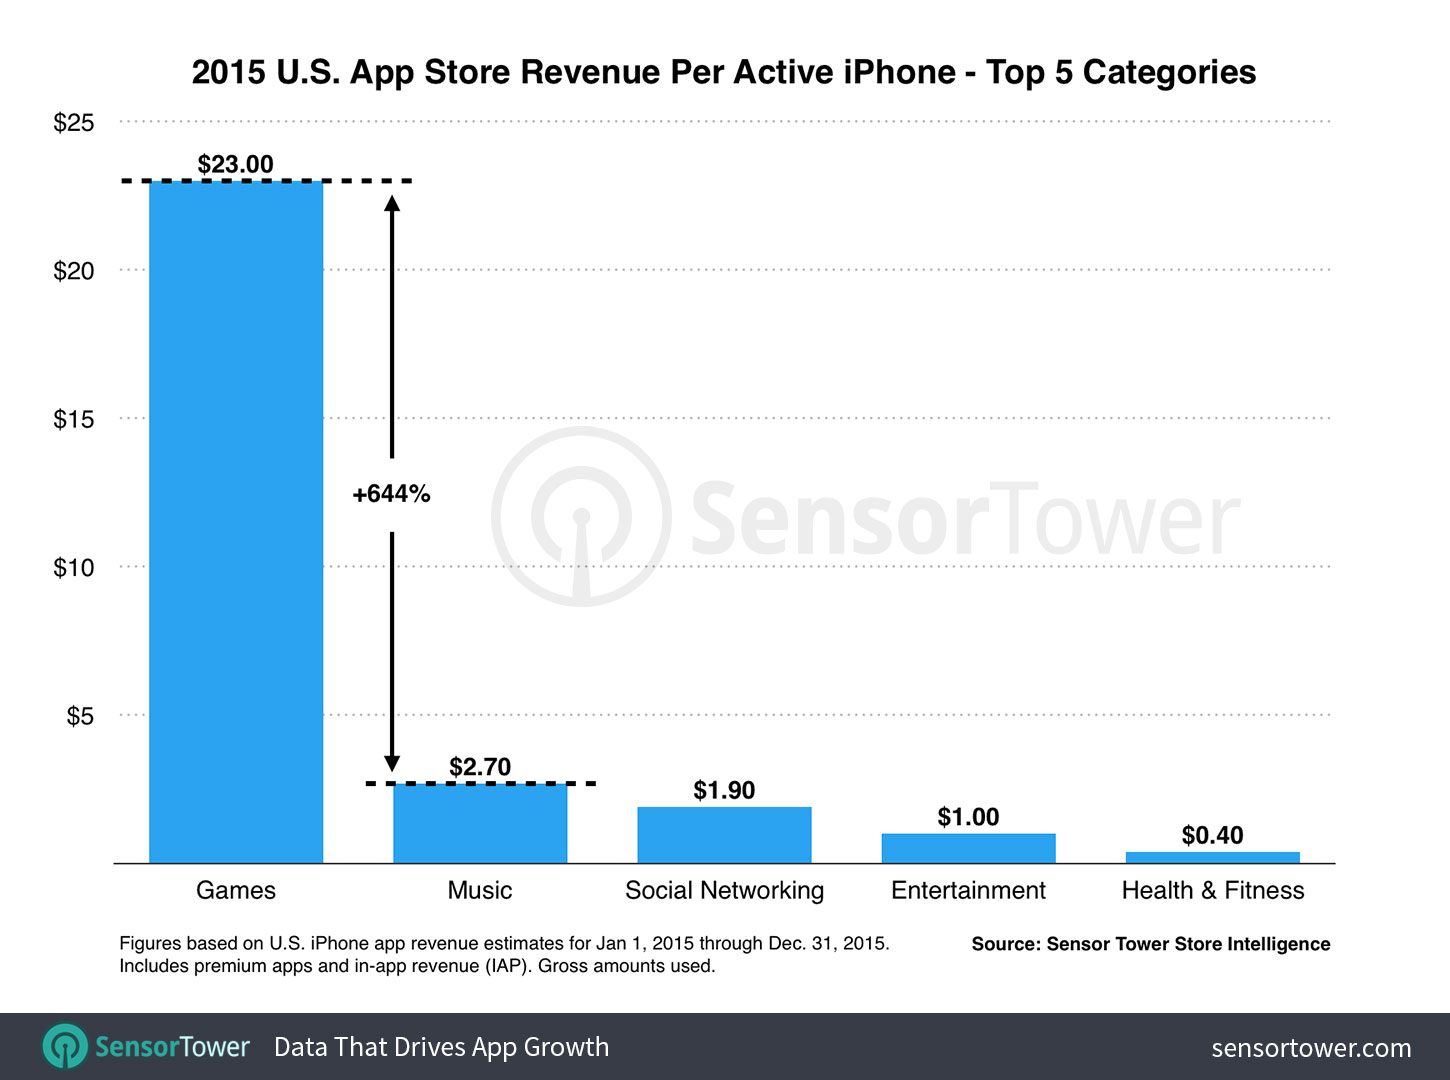
As the U.S. App Store's largest category by revenue, it's not surprising that Games comprised the majority of per-device spending last year. What may surprise some is how much more was spent on games than the second-highest-grossing category, Music. On average, games accounted for approximately $23 of the $33 spent across the iPhones active in the U.S. during 2015. Second-place Music accounted for $2.70, or close to one-tenth of Games.
Social Networking, Entertainment, and Health & Fitness rounded out the top five categories, at $1.90, $1, and $0.40 spent, respectively. The remaining $4 was spent on the App Store's 18 other categories that generated revenue during the period we studied.
Average App Installs Per Active iPhone

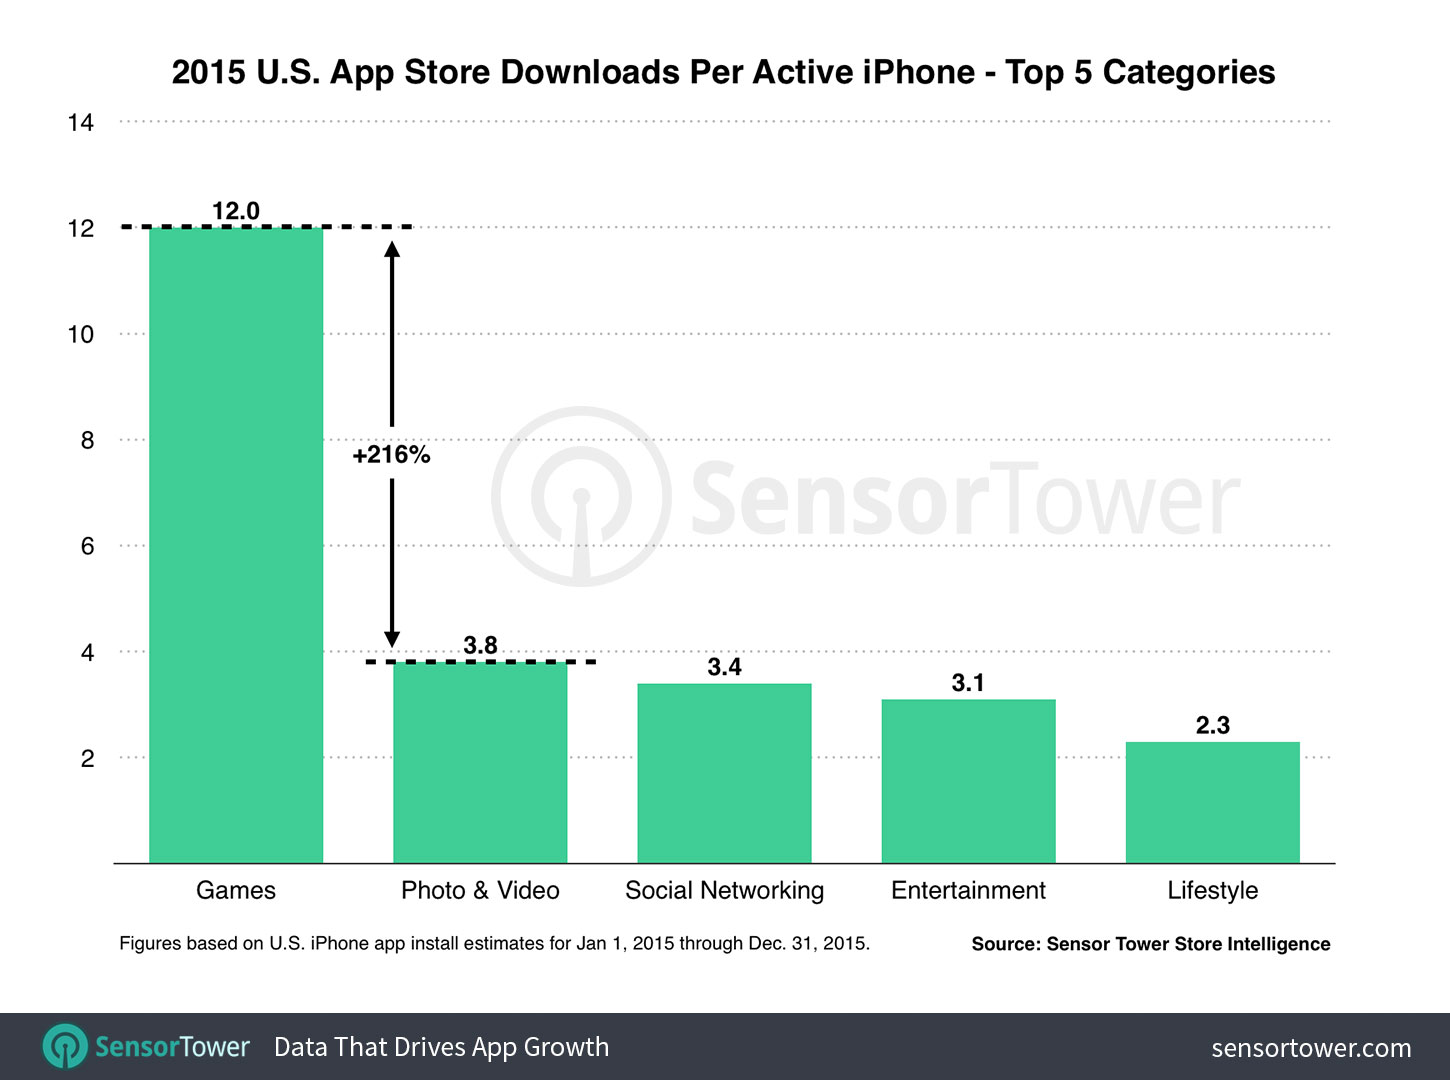
Looking at app installs, the Games category was dominant here as well, with 12 apps downloaded on average per active iPhone in the U.S. That was more than three times the average number of apps downloaded for Photo & Video, the second-most-downloaded category with 3.8 per device.
Social Networking was a close third with an average of 3.4 apps downloaded, while Entertainment and Lifestyle rounded out the top five with an average of 3.1 and 2.3 downloads per device, respectively.
Getting Installed vs. Getting Paid
Those familiar with App Store trends (and who've followed our quarterly Data Digests) know that the Games category offers developers access to not only the largest subset of app consumers, but also the one willing to spend the most on premium apps and IAP. We estimate that each game install—an average of 12 per device—grosses an average of $1.96.
It's much more difficult for Medical apps to secure installs, by comparison, as they are the second least likely to be downloaded after Catalogs at an average of 0.2 per device in 2015. These apps have the third highest average gross revenue per install at $0.63, however, which may make the acquisition of these users worth the effort.
