2026 State of Mobile is Live!
Mobile App Insights · Randy Nelson · April 2018
U.S. iPhone Users Spent An Average of $58 on Apps in 2017, 23% More Than the Year Before
Sensor Tower Store Intelligence finds that American consumers spent more on apps in 2016 versus 2015 per active iPhone.

U.S. iPhone users spent 23 percent more on in-app purchases (IAP) and premium apps in 2017 than the year before, Sensor Tower Store Intelligence data reveals. The average amount spent per active iPhone increased to an estimated $58 last year, up from $47 in 2016. This spending does not include purchases made in shopping apps such as Amazon or payments to ride sharing apps like Uber, for example. It does, however, reflect revenue earned by apps including Netflix and Tinder, not to mention the store's ever-growing number of free-to-play mobile games, which once again represented the lion's share of consumer expenditure.
In the following charts, we'll show how this spending broke down across the top earning app categories last year compared to 2016.
Average Revenue Per Active iPhone
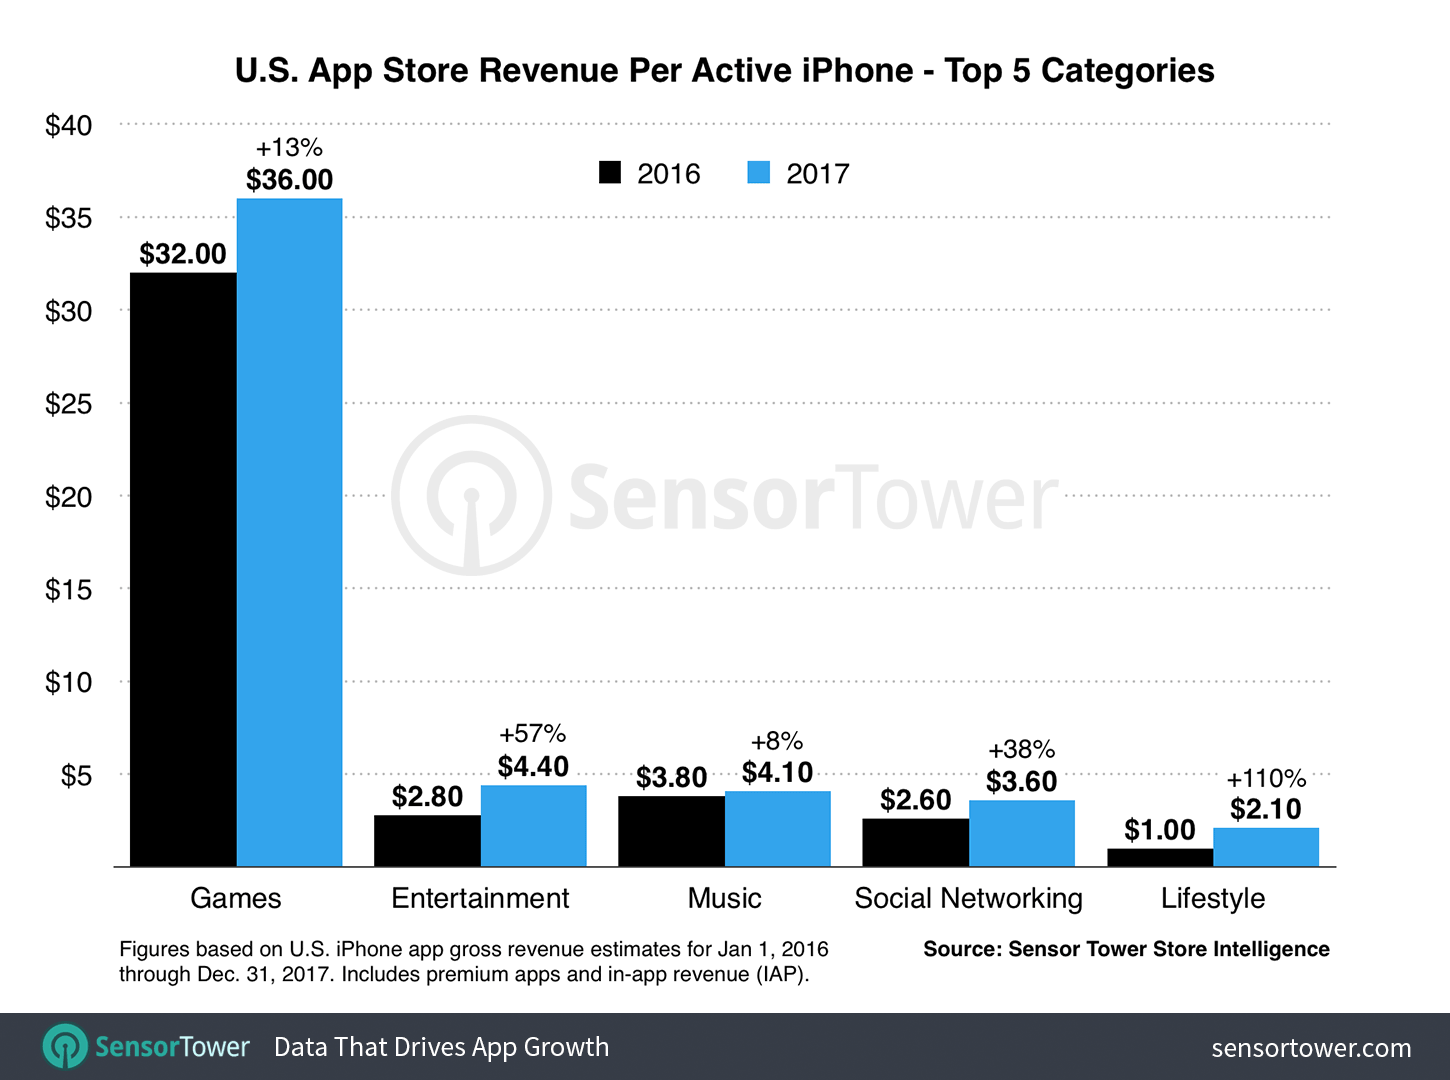
Mobile games represented the single largest category of spending in iPhone apps on the App Store last year in the United States, accounting for approximately more than half of all money spent. On a per-device level, games contributed about $36 of the $58 spent per device, or 62 percent, based on our analysis. As the chart below shows, this translated into a 13 percent increase in per-device spending for the category year-over-year, up from $32 in 2016.

Among the top five largest app categories by U.S. App Store revenue last year, Lifestyle apps posted the most significant year-over-year increase in per-device spending, growing 110 percent—or more than double 2016—to an average of $2.10 per iPhone. Dating apps such as Tinder and Bumble, which more than doubled their annual revenue from U.S. iPhones last year, were among the top earners in this category.
The Entertainment and Social Networking categories also saw significant growth over the previous year of 57 and 38 percent, respectively, to $4.40 and $3.60 per device. The Music app category displayed the smallest year-over-year growth among the five highest-earning categories at 8 percent to $4.10 per device.
As we discussed in our 2016 analysis of per-iPhone app spending, the Entertainment category was that year's big mover in terms of year-over-year growth, having increased by 180 percent over 2015. That said, while not as profound, last year's growth was nonetheless impressive.
Average App Installs Per Active iPhone
In addition to revenue, we also analyzed the growth of app installs across the active base of U.S. iPhones last year. Our research revealed a nearly 10 percent increase between 2016 and 2017 to 45 apps downloaded per phone. In other words, U.S. iPhone users installed an average of four more new apps in 2017 compared to the year before.

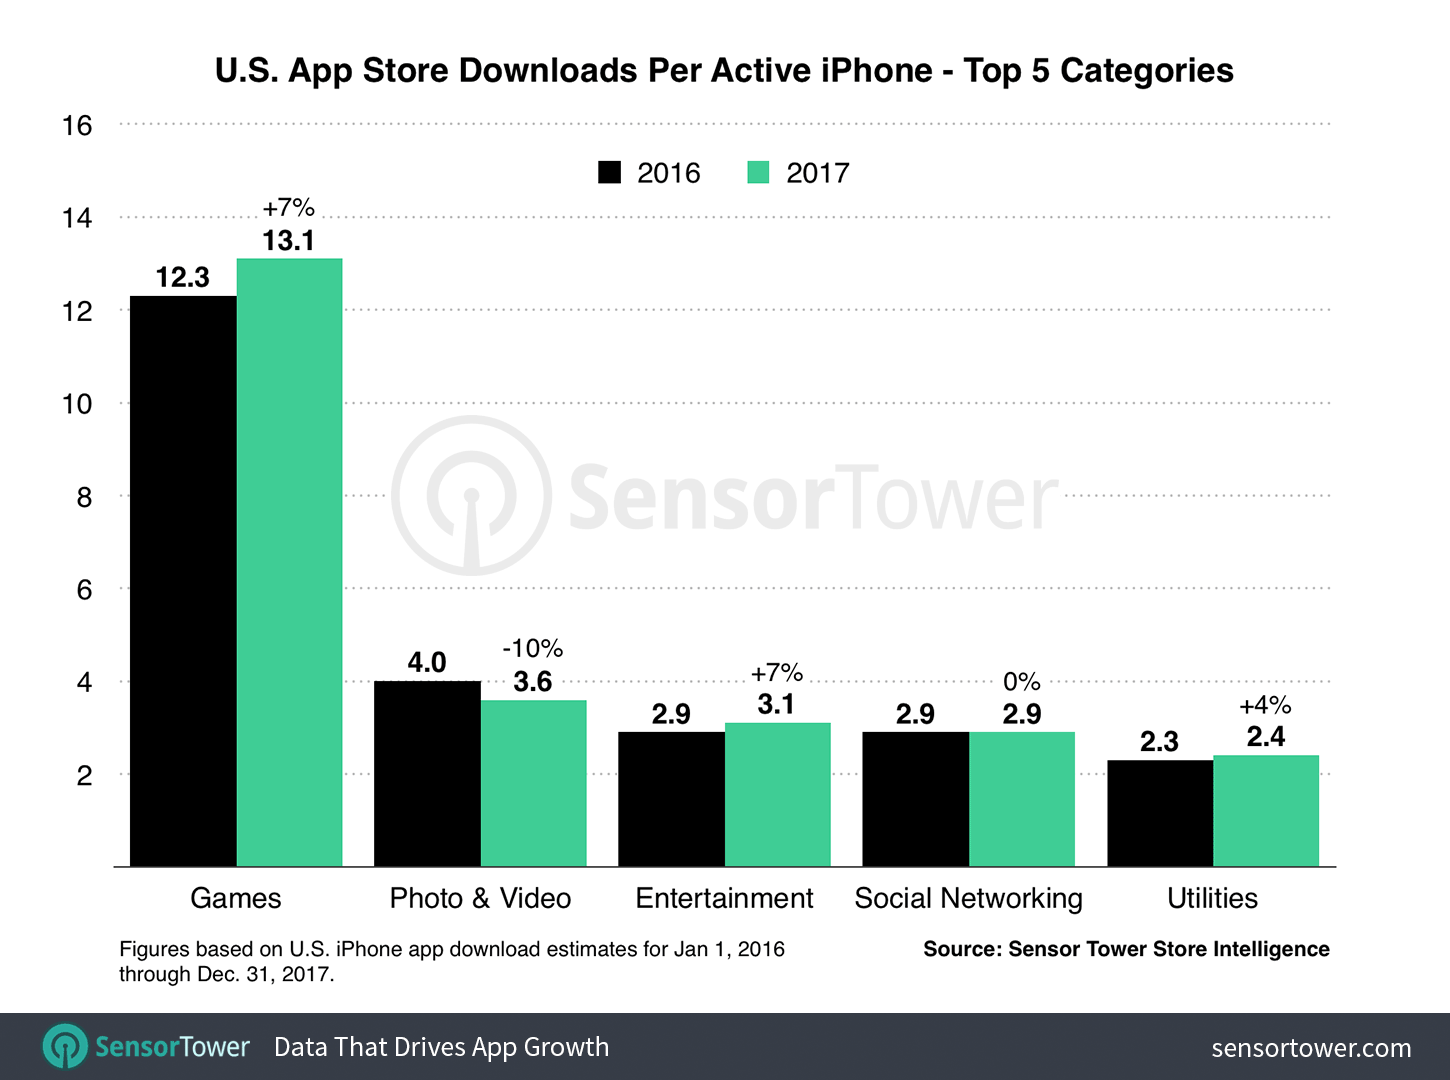
Games again made up the largest share of those apps at just over 13 installed per device, up from 12.3 in 2016, a 7 percent increase year-over-year. Among the remaining most-downloaded categories on iPhone last year in the U.S., Entertainment grew 7 percent from 2.9 per device to 3.1 on average, and Utilities grew 4 percent from 2.3 to 2.4 per phone. Social Networking was unchanged at 2.9 installs per device, while Photo & Video app installs per iPhone decreased 10 percent year-over-year from 4 installs to 3.6 per phone.
These per-device metrics reflect trends we're seeing on both app stores worldwide, including the growth in number of Entertainment apps released and the consolidation of Social Networking downloads around a handful of the largest apps, primarily those owned by Facebook. The downturn in Photo & Video installs per device is significant but not alarming, although developers looking to bring these types of apps to market should definitely take notice of the trend.
The ultimate message here remains that, in terms of downloads and revenue, U.S. iPhone owners are installing and spending more than ever.
About The Data in This Report
The figures in this report are based on an estimate of active iPhone devices in the United States for calendar years 2016 and 2017, as produced by Sensor Tower. iPhone app download and revenue estimates for the corresponding period were generated by Sensor Tower's Store Intelligence platform. Amounts for 2016 have been updated using the most current estimates available.
