2026 State of Mobile is Live!
Mobile App Insights · Randy Nelson · February 2017
U.S. iPhone Users Spent An Average of $47 on Apps in 2016
Sensor Tower Store Intelligence finds that American consumers spent more on apps in 2016 versus 2015 per active iPhone.

U.S. iPhone users spent more on premium apps and in-app purchases (IAPs) per device last year than in 2015—an average of $47 per iPhone, versus $33 the year before—according to Sensor Tower Store Intelligence data. While mobile games still dominated consumer spending in 2016, big gains by other categories (such as Entertainment, which saw per-device spend more than double) helped grow overall revenue per iPhone considerably.
In this report, we'll look at the leading categories by per-device spending for 2016, including their year-over-year growth, along with average app installs by category.
Average Revenue Per Active iPhone

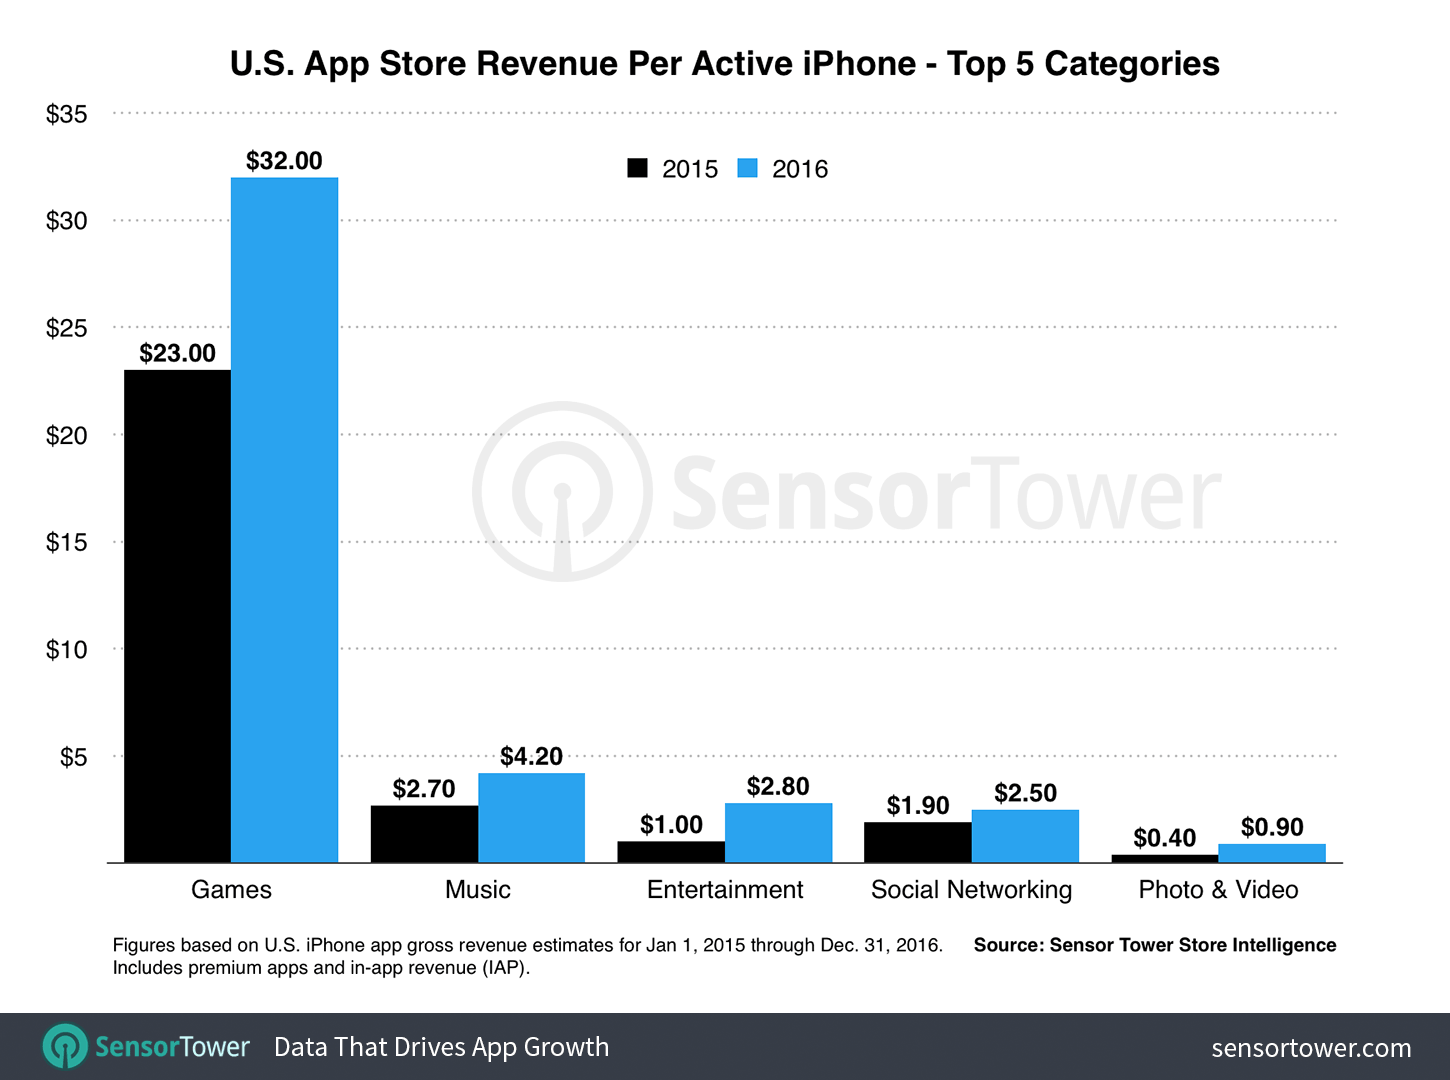
More than 80 percent of U.S. App Store revenue in 2016 was generated by games, which was reflected on the device level by the overwhelming portion of the $47 total they comprised. U.S. iPhone owners spent an average of $32 per device on games last year, up from $23 in 2015.
While this is an impressive figure, and further proof that monetization of mobile games continues to improve, the real standout of our findings was the year-over-year growth of Entertainment category spending, which was up by 180 percent, from $1.00 in 2015 to $2.80 in 2016. This category includes some of the U.S. App Store's historically highest grossing apps, such as HBO NOW, Hulu, and Netflix. The latter's revenue growth throughout 2016 was a significant contributor to the entire Entertainment category's year-over-year gains.
Netflix began monetizing through App Store subscriptions in Q4 2015, contributing approximately $7.9 million in gross revenue to the category during that period; in Q4 2016, that amount grew to more than $58 million.
The rest of the top five grossing categories on a per-device basis also showed varying degrees of growth over 2015, most prominently Photo & Video—the primary category of YouTube with its successful YouTube Red subscription option—which grew from $0.40 to $0.90. The Music category grew from $2.70 to $4.20 per device, while the Social Networking category, which includes the likes of Tinder, grew from $1.90 to $2.50.
Average App Installs Per Active iPhone

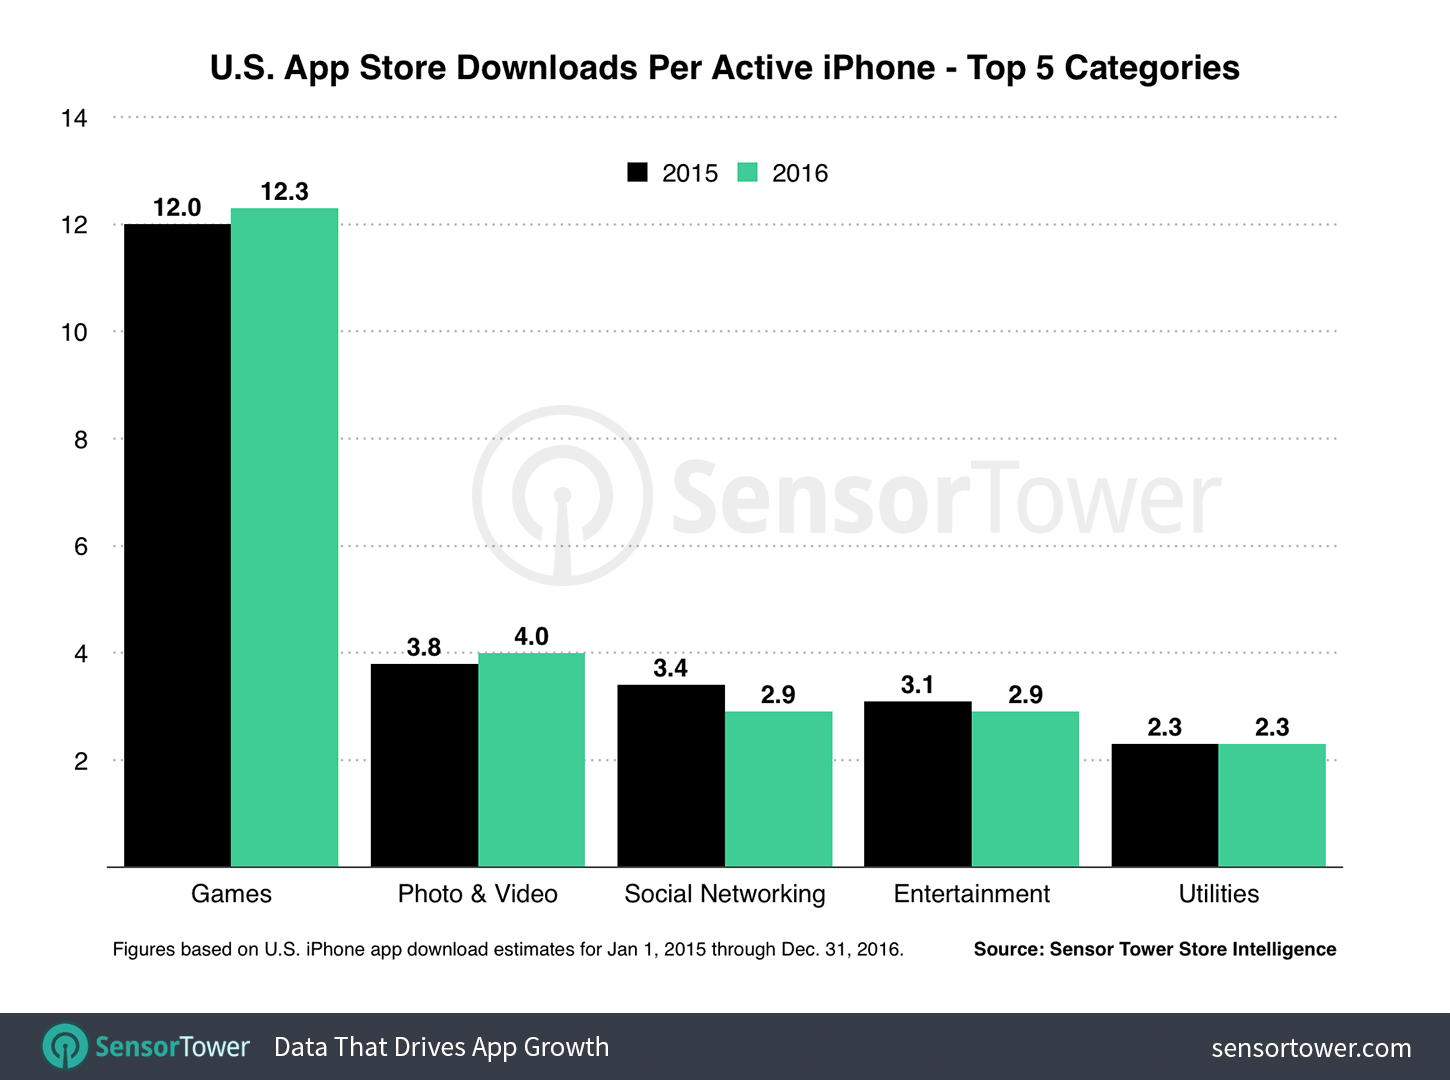
Looking at the other side of the coin—namely app installs—we found that the average number of app downloads per device remained unchanged over 2015 at approximately 41. Games, the largest category in terms of new downloads last year, saw per-device installs hold steady a 12, the same as last year.
Social Networking declined, however. In 2015, an average of 3.4 apps in the category were downloaded per iPhone in the U.S.; last year that number decreased to 2.9.
This device-level data adds weight to a greater theme we've been tracking, where downloads for certain categories, such as Social Networking, continue to coalesce around the most dominant apps (in this case Facebook, Messenger, Snapchat, etc.). It's still possible for new apps to find success in these categories, but the data shows that, more and more often, users are being drawn to the most well-established apps when deciding what to install on their devices. However, it's not yet to the extent of revenue, where we've already shown that 1 percent of monetizing publishers are responsible for more than 94 percent of in-app spending on the App Store.
About The Data in This Report
The figures in this report are based on an estimate of active iPhone devices in the United States for calendar year 2016 (January 1 through December 31), as produced by Sensor Tower. iPhone app download and revenue estimates for the corresponding period were generated by Sensor Tower's Store Intelligence platform.
Note: This analysis has been revised since its original publication based on our latest model of active iPhone handsets in the U.S. for 2015. The revenue estimates displayed above are gross amounts spent by consumers on the App Store before Apple's 30 percent cut of revenue has been deducted, and are not inclusive of taxes.
