2026 State of Mobile is Live!
Mobile App Insights · Randy Nelson · February 2019
U.S. iPhone Users Spent An Average of $79 on Apps in 2018, 36% More Than 2017
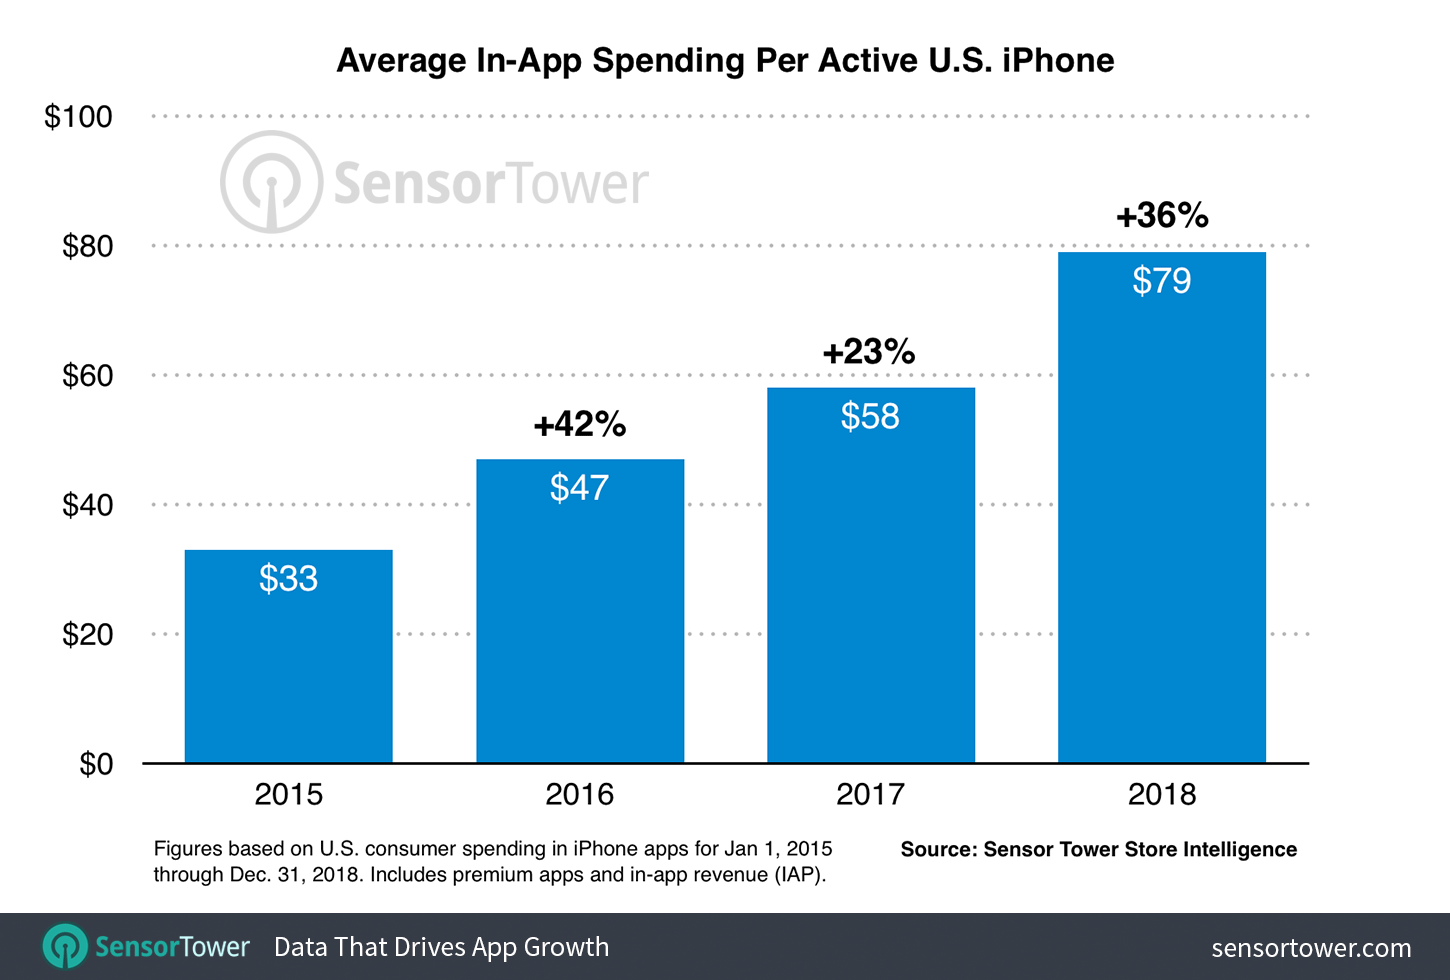
Sensor Tower Store Intelligence finds that American consumers spent 36% more on apps in 2018 versus 2017 per active iPhone.

iPhone users in the United States spent an average of $21 more on in-app purchases (IAP) and premium apps during 2018 than the year before, for a total of $79 per active device, according to Sensor Tower Store Intelligence data. These figures do not include spending in commerce apps such as Amazon, rideshare apps like Uber, or other apps where purchases are not processed through the App Store.
In the following charts, we'll show how this spending has increased year-over-year and grew among the top grossing categories of apps on the store compared to 2017.
Average Revenue Per Active iPhone
Per device app spending on U.S. iPhone grew more year-over-year between 2017 and 2018 than it did between 2017 and 2016, when the average increased 23 percent from $47 to $58. As our data shows, this was slightly less than the 42 percent growth in average per device spending seen between 2015 and 2016, when the amount grew from $33 to $47. Since 2015, annual per device app spending in the U.S. has grown 139 percent, with a compound annual growth rate (CAGR) of 33.8 percent.

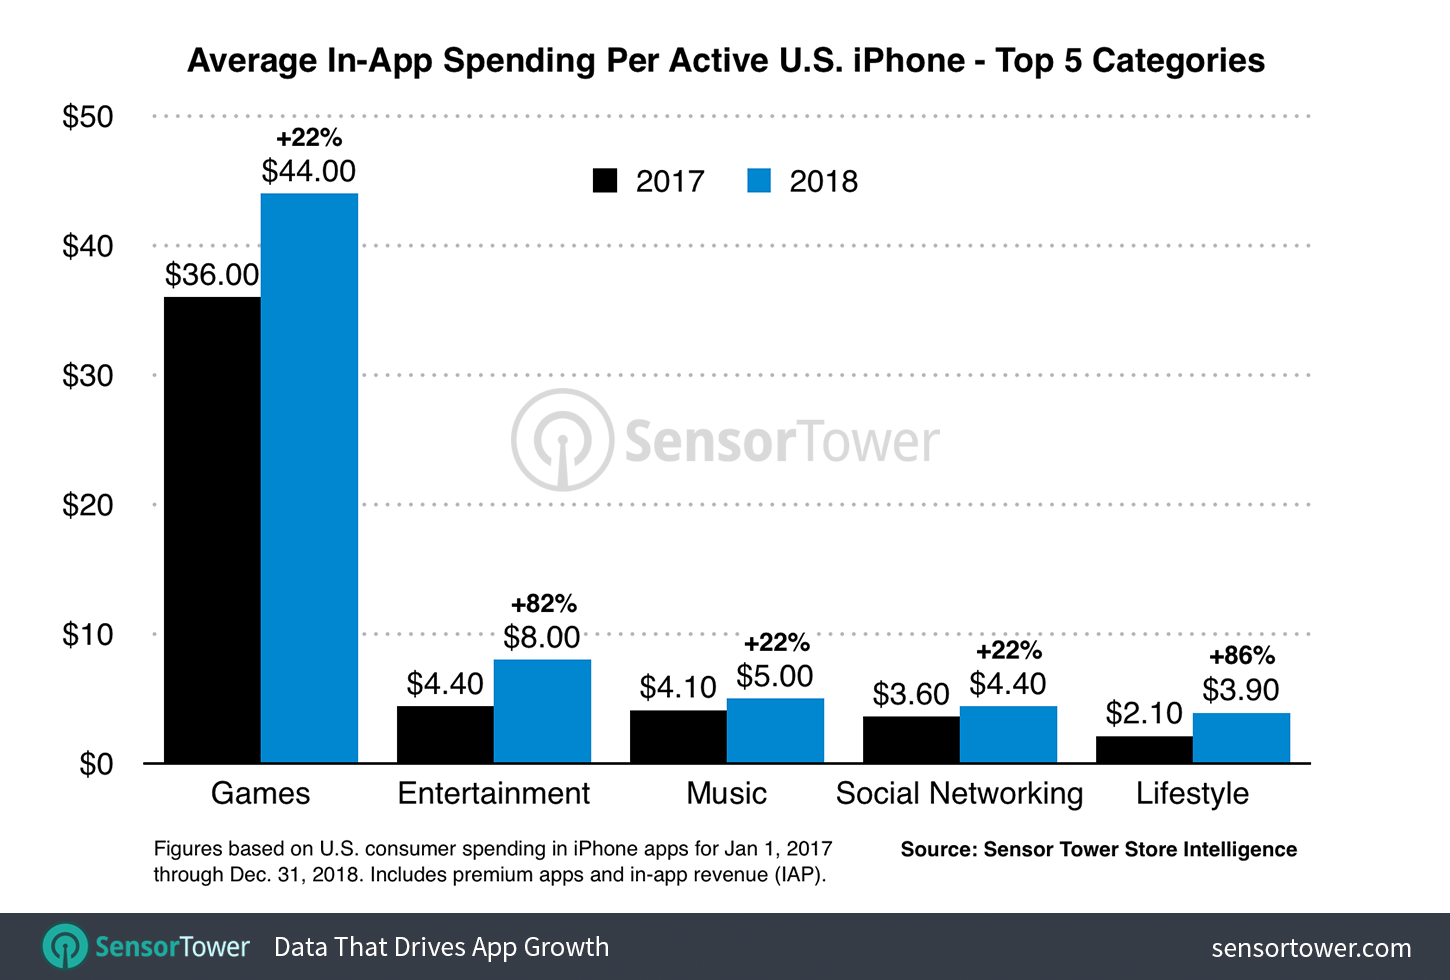
Spending in mobile games accounted for close to 56 percent—more than half—of the average spent per active iPhone in the U.S. last year at $44. This was less than the 62 percent share of per device spending games represented 2017, when $36 of the $58 spent went to them. However, games saw a 22 percent year-over-year increase in per device spending between 2017 and 2018, versus 13 percent growth between 2016 and 2017.
Top App Categories By Average Spending Per iPhone
While mobile games led in terms of the total amount spent on average, other app categories experienced greater year-over-year growth in 2018 according to our findings. These included two of the other top five categories by spending, Entertainment and Lifestyle, which saw their per device spending grow by 82 percent and 86 percent, respectively. Ranked No. 2 in terms of average spending per device last year, Entertainment accounted for $8 of the $79 total, up from $4.40 in 2017. Lifestyle, ranked No. 5, grew to $3.90 per device from $2.10 the year before.

While the category didn't make the top five, spending in Health & Fitness category apps grew 75 percent year-over-year to an average of $2.70, up from $1.60 in 2017. Along with the significant growth seen in Entertainment and Lifestyle category spending, the clear message here is that in-app subscriptions—which appear in all of these categories' top-grossing apps—are driving substantial per device increases in the amount spent by U.S. consumers on iPhone.
Ultimately, our findings confirm that while the number of new iPhone users added annually is naturally slowing in the U.S. as the market reaches saturation, owners of these devices continue to spend more than ever on average—and in ever-increasing amounts across all categories, particularly where in-app subscriptions are factors. For developers, this should be a clear sign that categories in addition to mobile gaming do hold great revenue potential. For Apple, we see a definite direction for the future growth of apps within its services business revenue, even if faced with slowing hardware sales.
About The Data in This Report
The figures in this report are based on an estimate of active iPhone devices in the United States for calendar years 2015 through 2018, as produced by Sensor Tower. iPhone app download and revenue estimates for the corresponding period were generated by Sensor Tower's Store Intelligence platform.
