2026 State of Mobile is Live!
Mobile App Insights · Katie Williams · November 2019
The Top 1% of App Publishers Generate 80% of All New Installs
The top 1 percent of publishers on the App Store and Google Play accounted for 80 percent of all unique downloads in Q3 2019, Sensor Tower Store Intelligence data shows.
New data from Sensor Tower’s Store Intelligence platform reveals that the top-performing 1 percent of publishers globally accounted for 80 percent of the 29.6 billion app downloads in Q3 2019, leaving just 20 percent—6 billion—for the remaining 99 percent of publishers to fight for.
There were more than 3.4 million apps available globally across the App Store and Google Play in 2018, an increase of 65 percent from the 2.2 million apps available in 2014. However, the percentage of apps that have been downloaded at least 1,000 times has decreased over the same period, from 30 percent in 2014 to 26 percent in 2018. In other words, in a continually growing market where most publishers are competing against the publishers controlling 80 percent of all new user acquisition, standing out among the competition is more crucial than ever.
Top 1 Percent by Downloads: All Apps
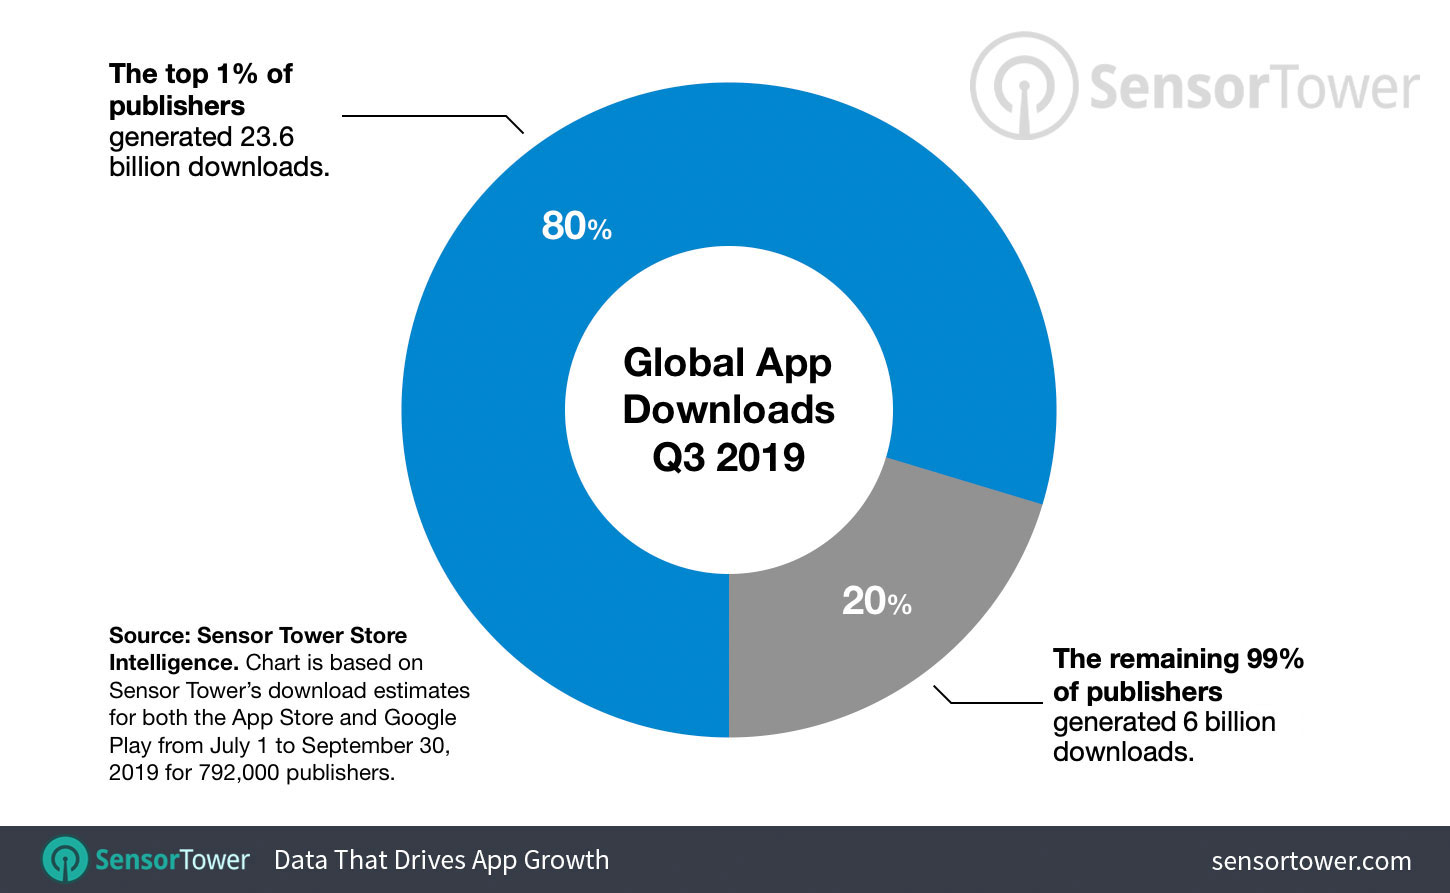
There were approximately 792,000 publishers globally across both the App Store and Google Play in 2019’s third quarter. The top 7,920, or 1 percent, of those publishers generated 23.6 billion unique installs, or 80 percent of both stores’ combined total of 29.6 billion downloads. That means the remaining 6 billion downloads were shared among the remaining 784,080 publishers—averaging out to approximately 7,650 downloads per publisher in this bottom 99 percent. That’s less than one thousandth of a percent of the downloads generated by a publisher like Facebook, which saw 682 million new installs during the same period.
Top 1 Percent by Downloads: Games
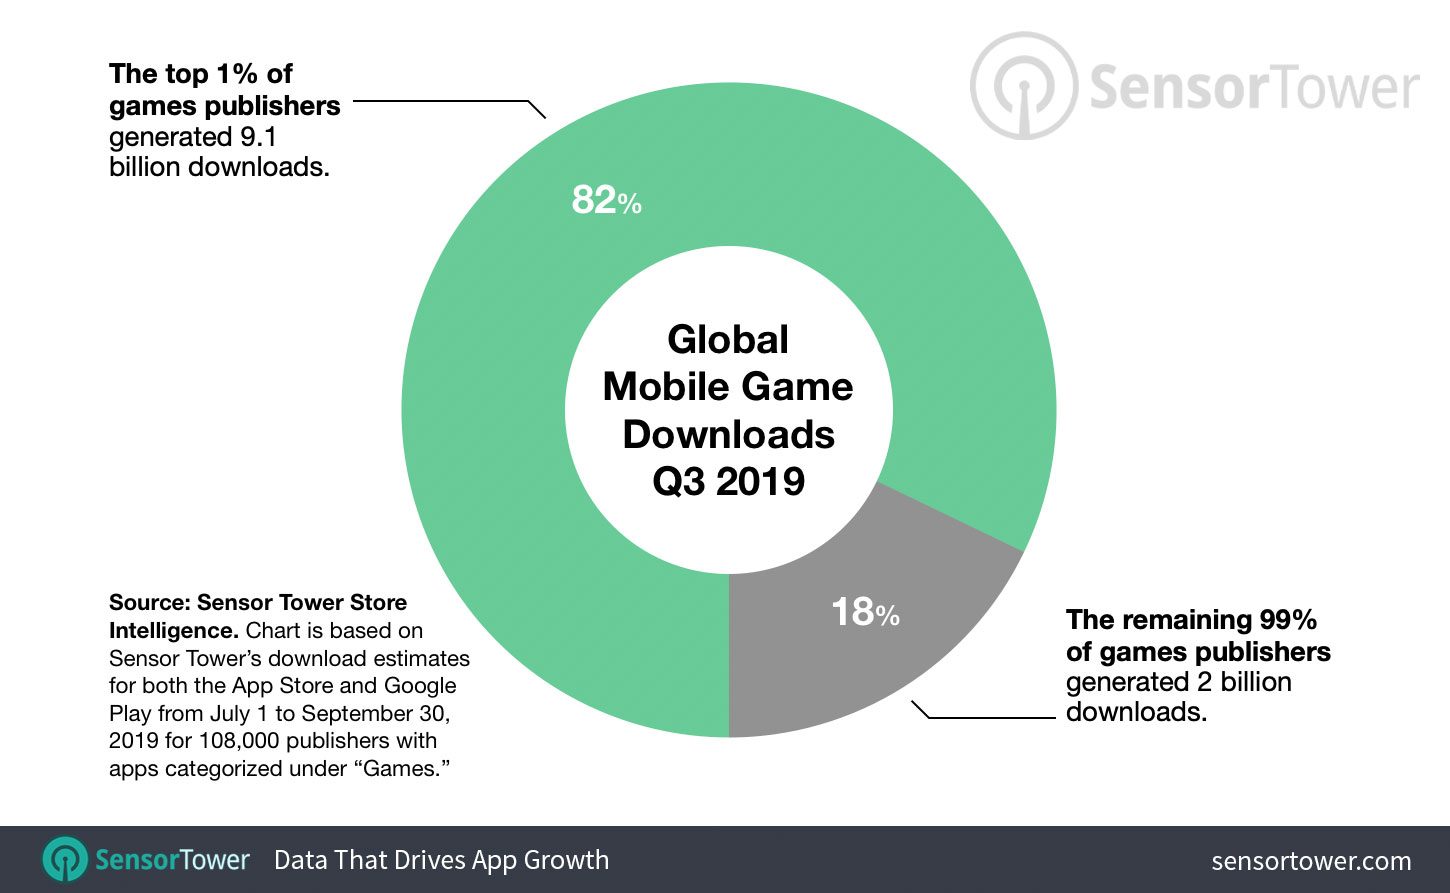
When we narrowed our lens to the 108,000 publishers of games in our analysis, we discovered that the 1,080 publishers making up the top 1 percent commanded 9.1 billion downloads out of a total of 11.1 billion, or 82 percent, averaging out to more than 8.4 million installs each.
The remaining 2 billion, or 18 percent, of downloads were split among the remaining 106,920 publishers in the bottom 99 percent. That flattens out to a slightly larger drop-in-the-pond average of approximately 18,000 downloads each.
Top 1 Percent by Revenue: All Apps
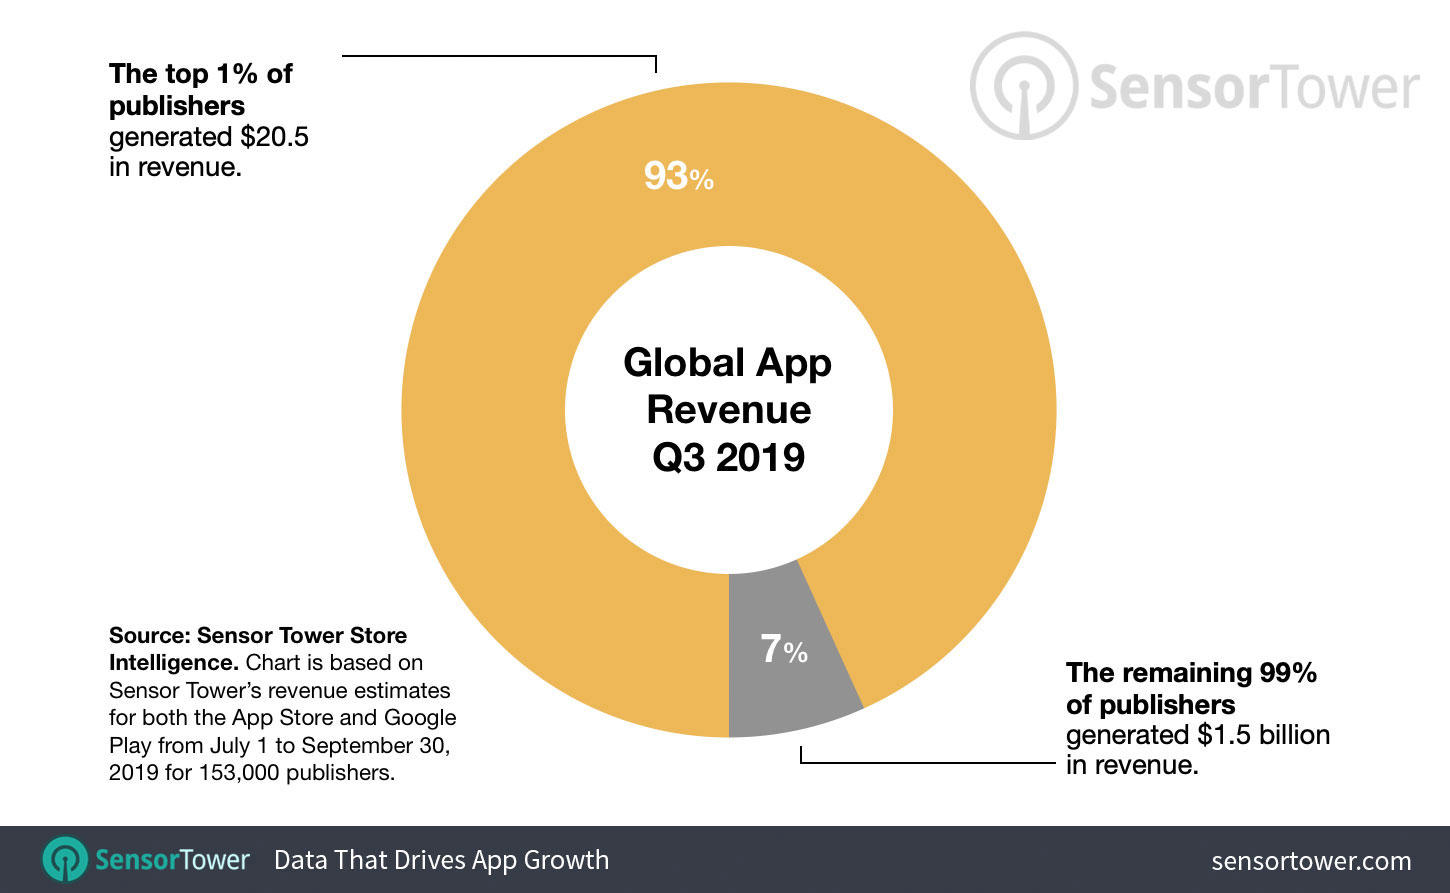
When we analyzed revenue, the gap widened further: Out of a total $22 billion in gross revenue generated during Q3 2019, the 1,526 publishers comprising the top 1 percent generated $20.5 billion. Meanwhile, just $1.5 billion, or 7 percent, or all revenue was left over for the 151,056 publishers in the bottom 99 percent. That averages out to a little more than $9,900 per publisher per quarter.
Top 1 Percent by Revenue: Games
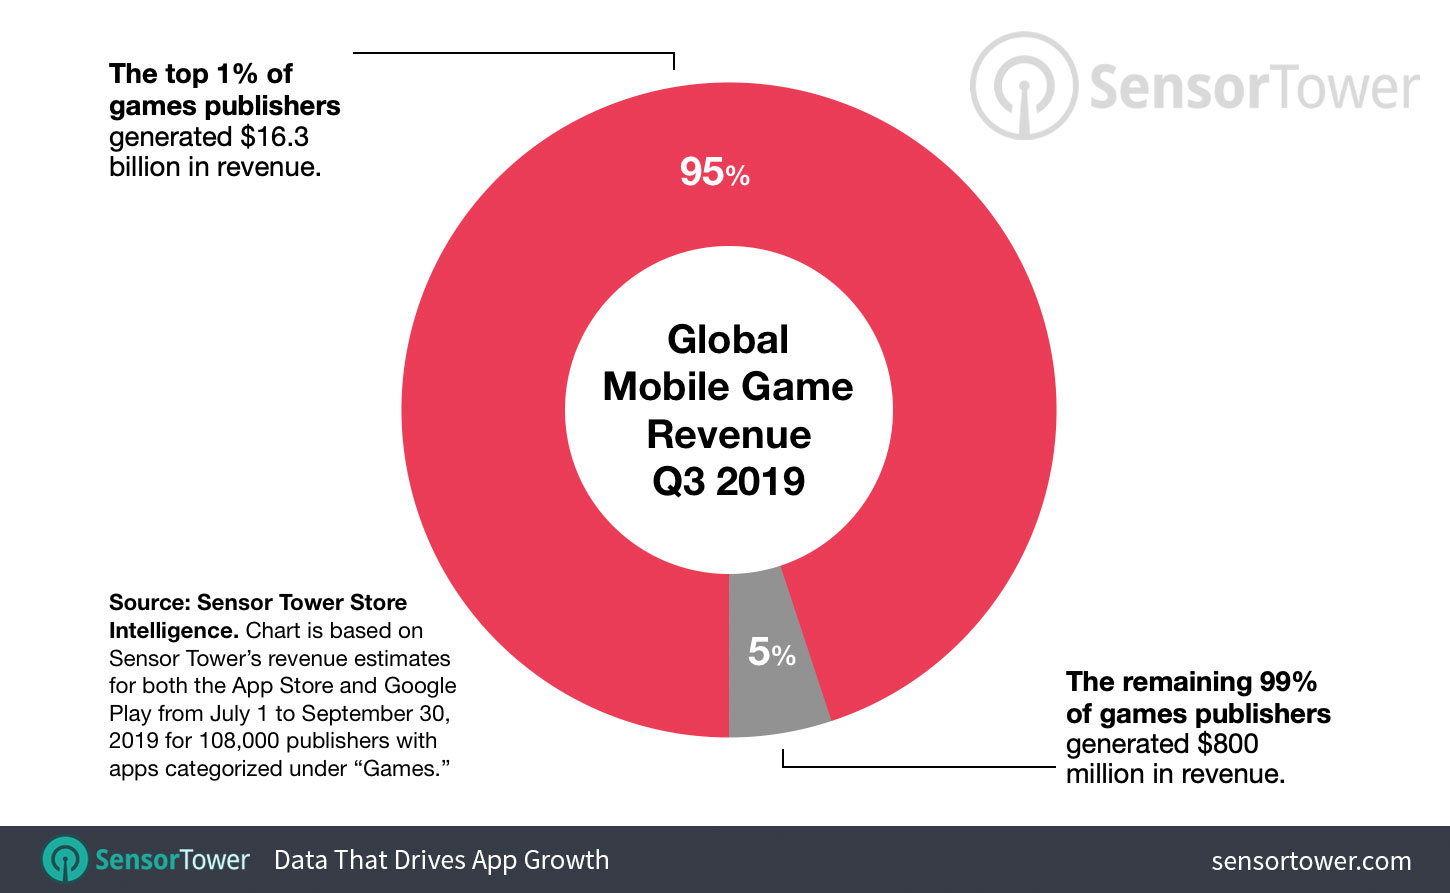
We saw the greatest disparity when looking at games revenue. Of the $16.3 billion brought in by games globally across Google Play and the App Store in Q3 2019, the 445 publishers in the top 1 percent of revenue-earners held $15.5 billion, or 95 percent of all revenue, with the remaining $800 million split between the 44,029 publishers in the bottom 99 percent, averaging a little more than $18,100 each.
Revenue from the top 1 percent of publishers globally was dominated by the Eastern Asian juggernauts of gaming: Q3 2019’s three highest earners were Tencent with approximately $2 billion in gross revenue, NetEase with $743 million, and Bandai Namco with $503 million.
Top 1 Percent Over the Years
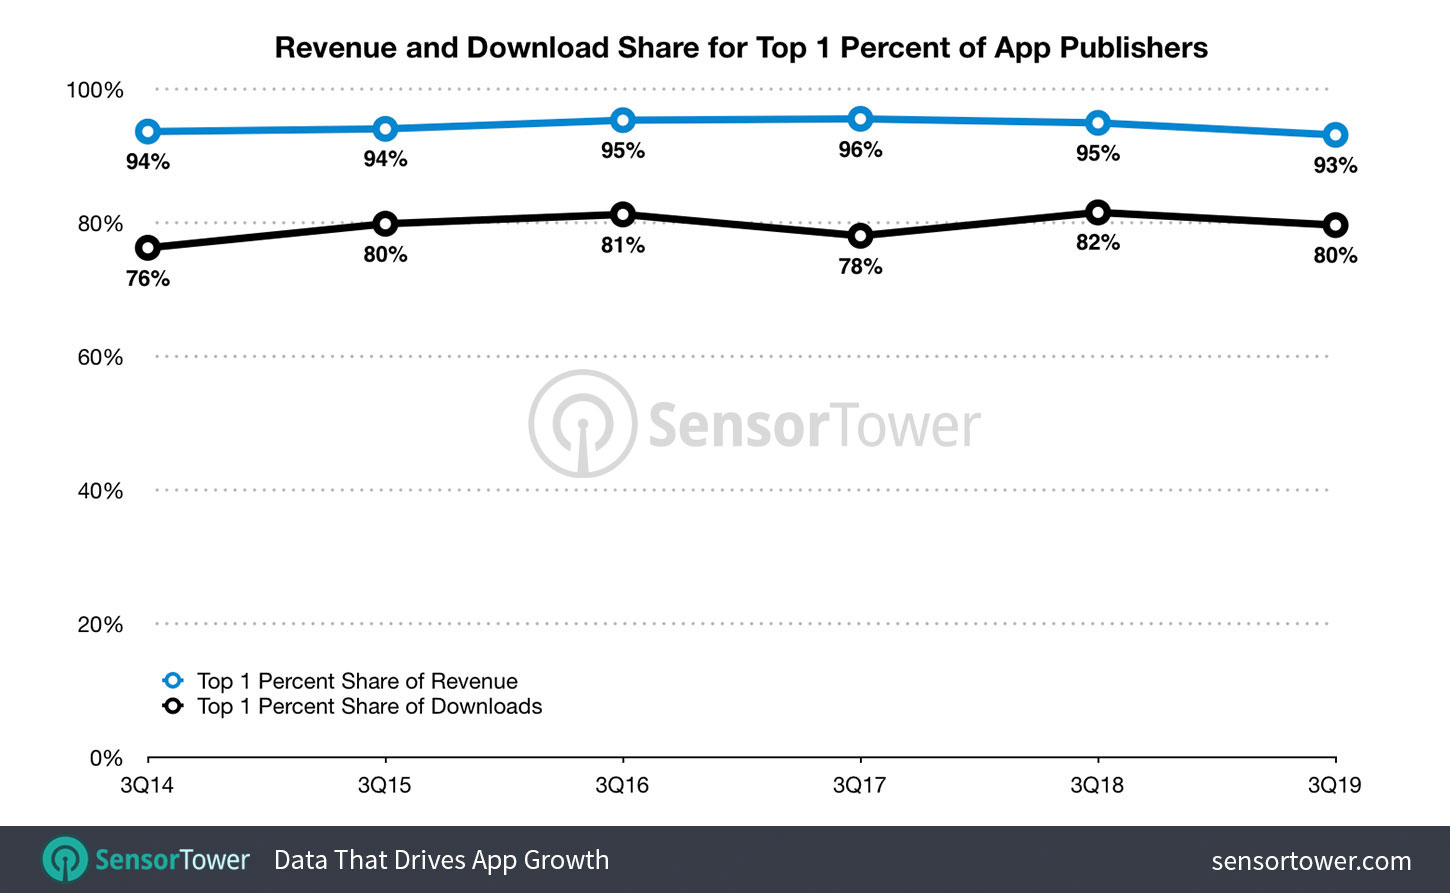
While the disparity between the 1 and 99 percenters, when examined in the above metrics, are plain as day, the lack of difference in the revenue and download figures over the years is just as telling. There has been very little fluctuation in the 1 percent’s revenue and download share dating back to Q3 2014—meaning that, if this trend remains unchanged, the vast majority of publishers will continue to compete for the minority of new users.
Given these factors, publishers will need to be persistent in improving the organic discoverability of their apps in addition to paid acquisition. This is possible through continual App Store Optimization aided by platforms such as App Intelligence. With the ever-increasing number of available apps on both stores creating a nearly endless pool of potential, we’re curious to see how these trends in popularity, discoverability, and market share evolve over time.
About Our Data
For this analysis, we looked at the estimated worldwide download and revenue totals of all publishers with apps ranking on the App Store and Google Play during Q3 periods from 2014 to 2019.
