2026 State of Mobile is Live!
Mobile App Insights · Stephanie Chan · March 2022
Global App Revenue Growth Was Flat in Q1 2022, While Usage Grew Nearly 5%
Sensor Tower data reveals that top Medical, Navigation, Travel, Business, and Shopping apps saw the most usage growth year-over-year in Q1 2022.
Global app adoption and consumer spending on in-app purchases, premium apps, and subscriptions across the App Store and Google Play were both relatively flat year-over-year in Q1 2022, Sensor Tower Store Intelligence data reveals. Meanwhile, the average number of monthly active users in top apps grew 4.8 percent Y/Y, with some categories, such as Medical apps, more than doubling compared to Q1 2021.
Global App Usage Trends
In an analysis of the top 100 most-used mobile apps worldwide in each category, Medical saw the highest Y/Y growth in usage with the average MAUs more than doubling in the top apps. Navigation apps saw the second highest growth in usage, climbing 23.5 percent Y/Y, and Travel came in third with nearly 19 percent Y/Y growth. This was a departure from the previous two first quarters, when Business apps saw the most Y/Y growth—in 1Q21, usage of the top Business apps grew 95.3 percent Y/Y and in 1Q20, the category saw 42.4 percent Y/Y growth.
The uptick in Navigation and Travel app usage in 1Q22 can be attributed to consumers making more trips now that the pandemic is somewhat controlled in parts of the world. The increase in MAUs among the top Medical apps was mainly driven by a surge in usage of COVID-related apps such as Indonesia’s PeduliLindungi, South Korea’s vaccine passport app COOV, and Brazil’s Conecte SUS. It could also be a result of users becoming acclimated to turning to mobile devices for such purposes.
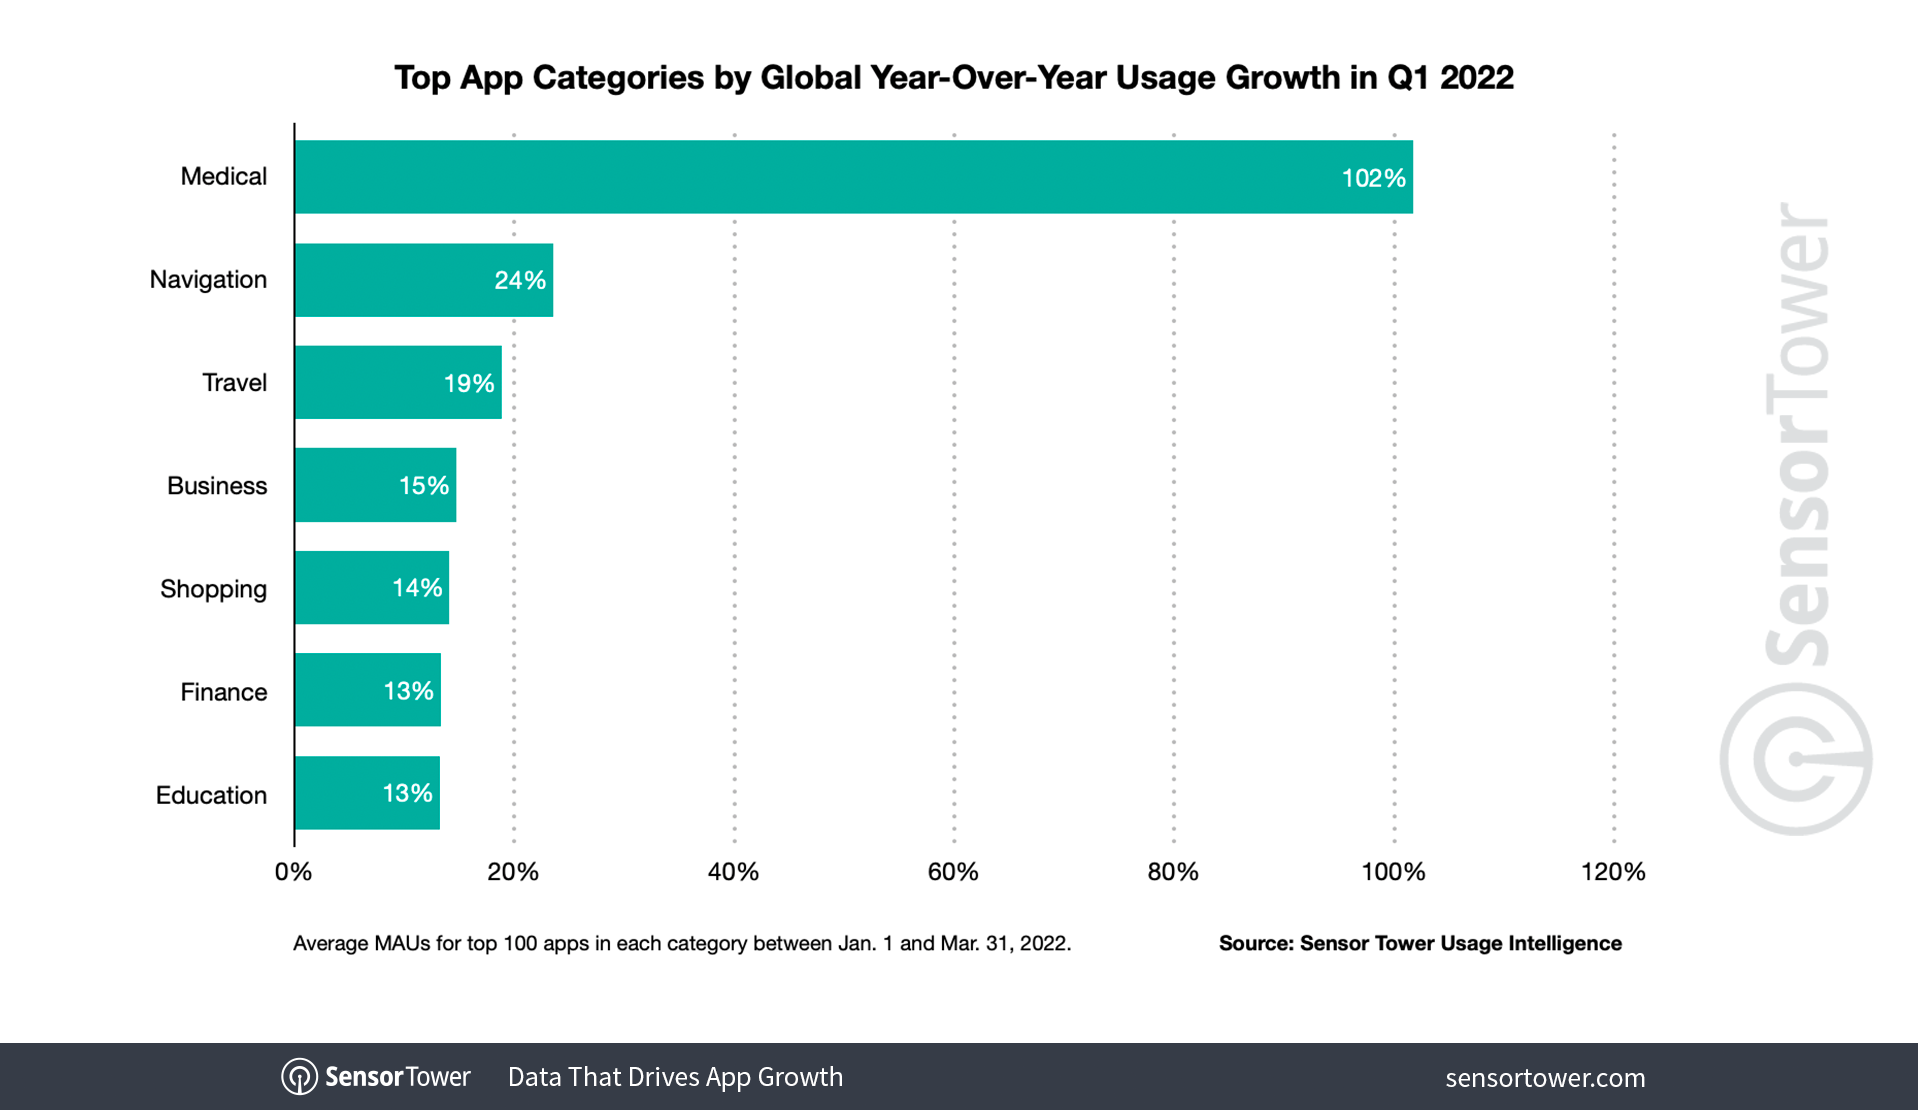
Nearly all categories studied saw an increase in usage, except for Weather, Lifestyle, News, and Games. Mobile games saw the largest decrease in usage compared to 1Q21, declining 3.8 percent Y/Y.
Worldwide Mobile App Revenue and Downloads
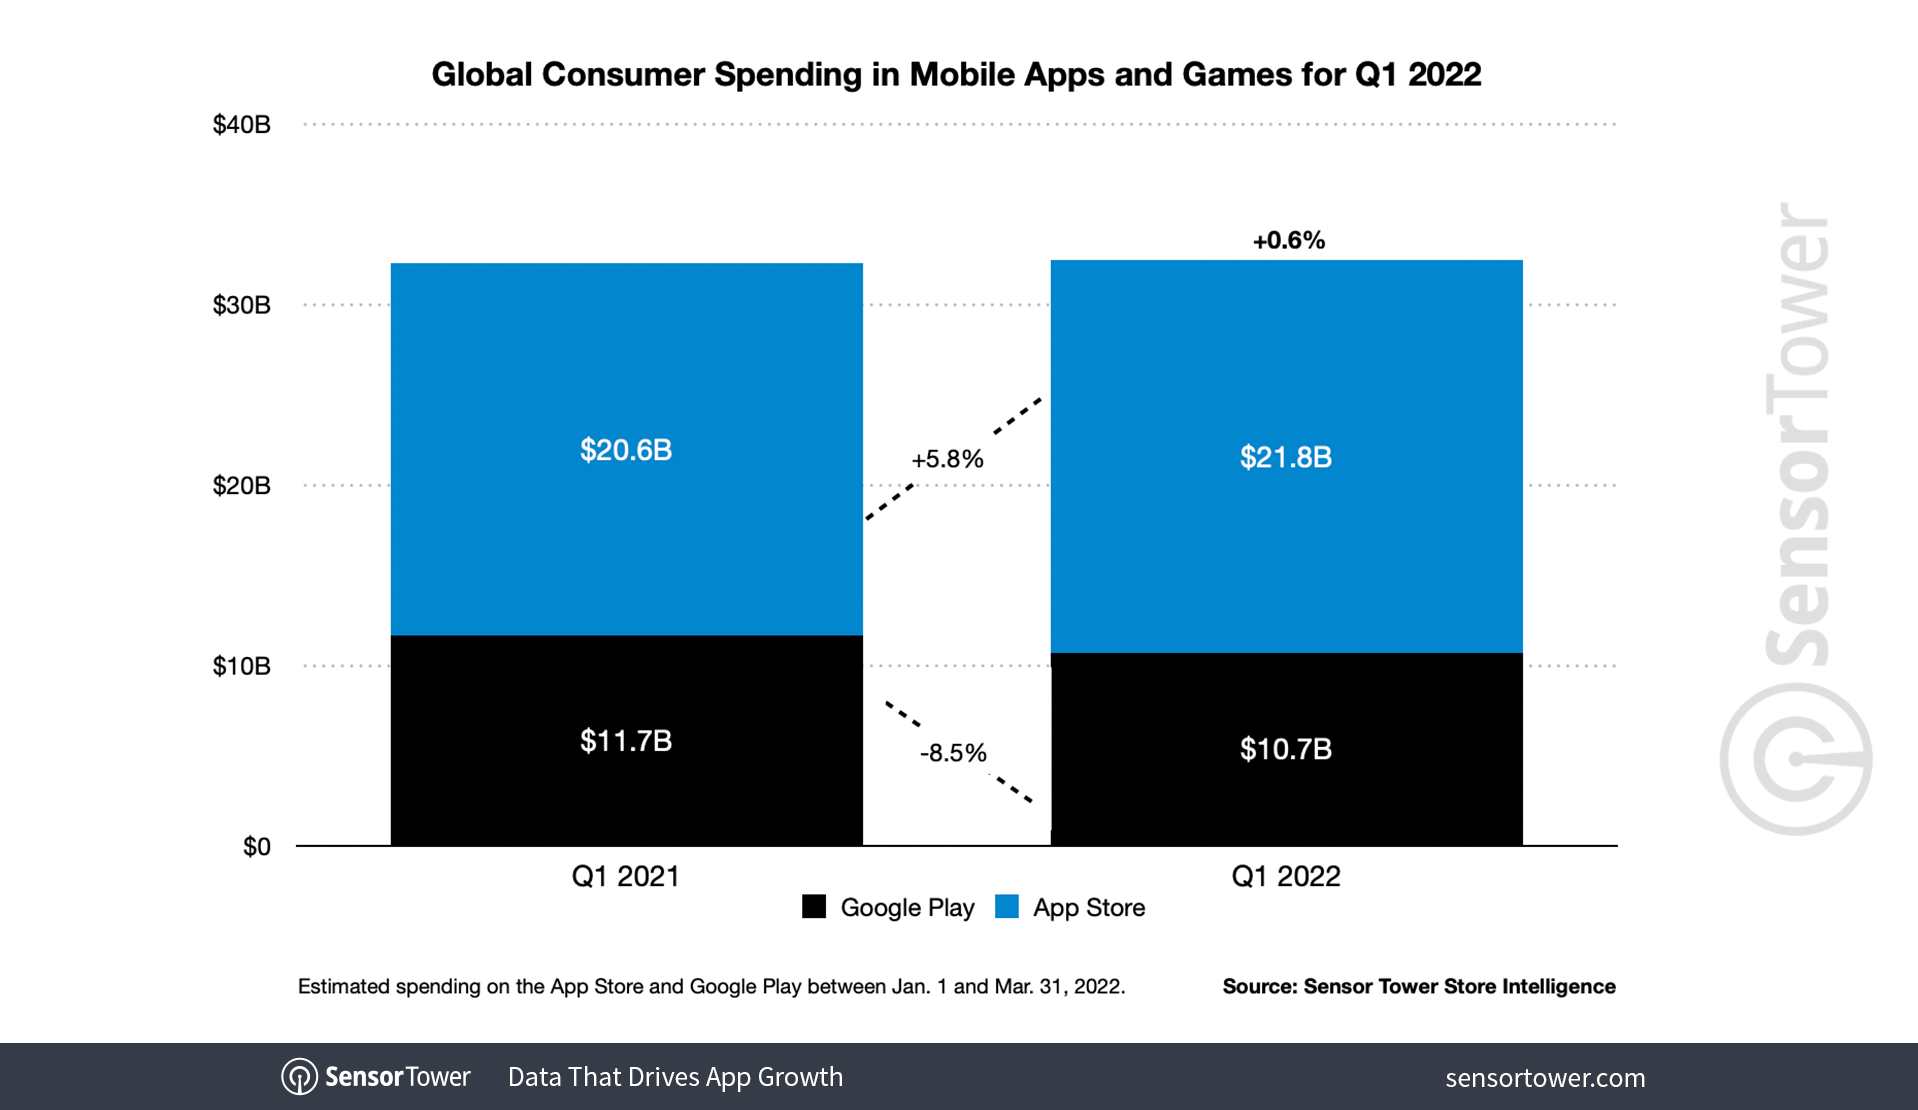
Global consumer spending on in-app purchases, premium apps, and subscriptions in apps and mobile games remained nearly flat Y/Y in 1Q22, reaching $32.5 billion—up 0.6 percent from $32.3 billion in 1Q21. The revenue generated by Apple’s marketplace was more than double that of Google Play’s, growing 5.8 percent Y/Y to $21.8 billion from $20.6 billion. Google Play saw approximately $10.7 billion in consumer spending, down 8.5 percent Y/Y from $11.7 billion in 1Q21.
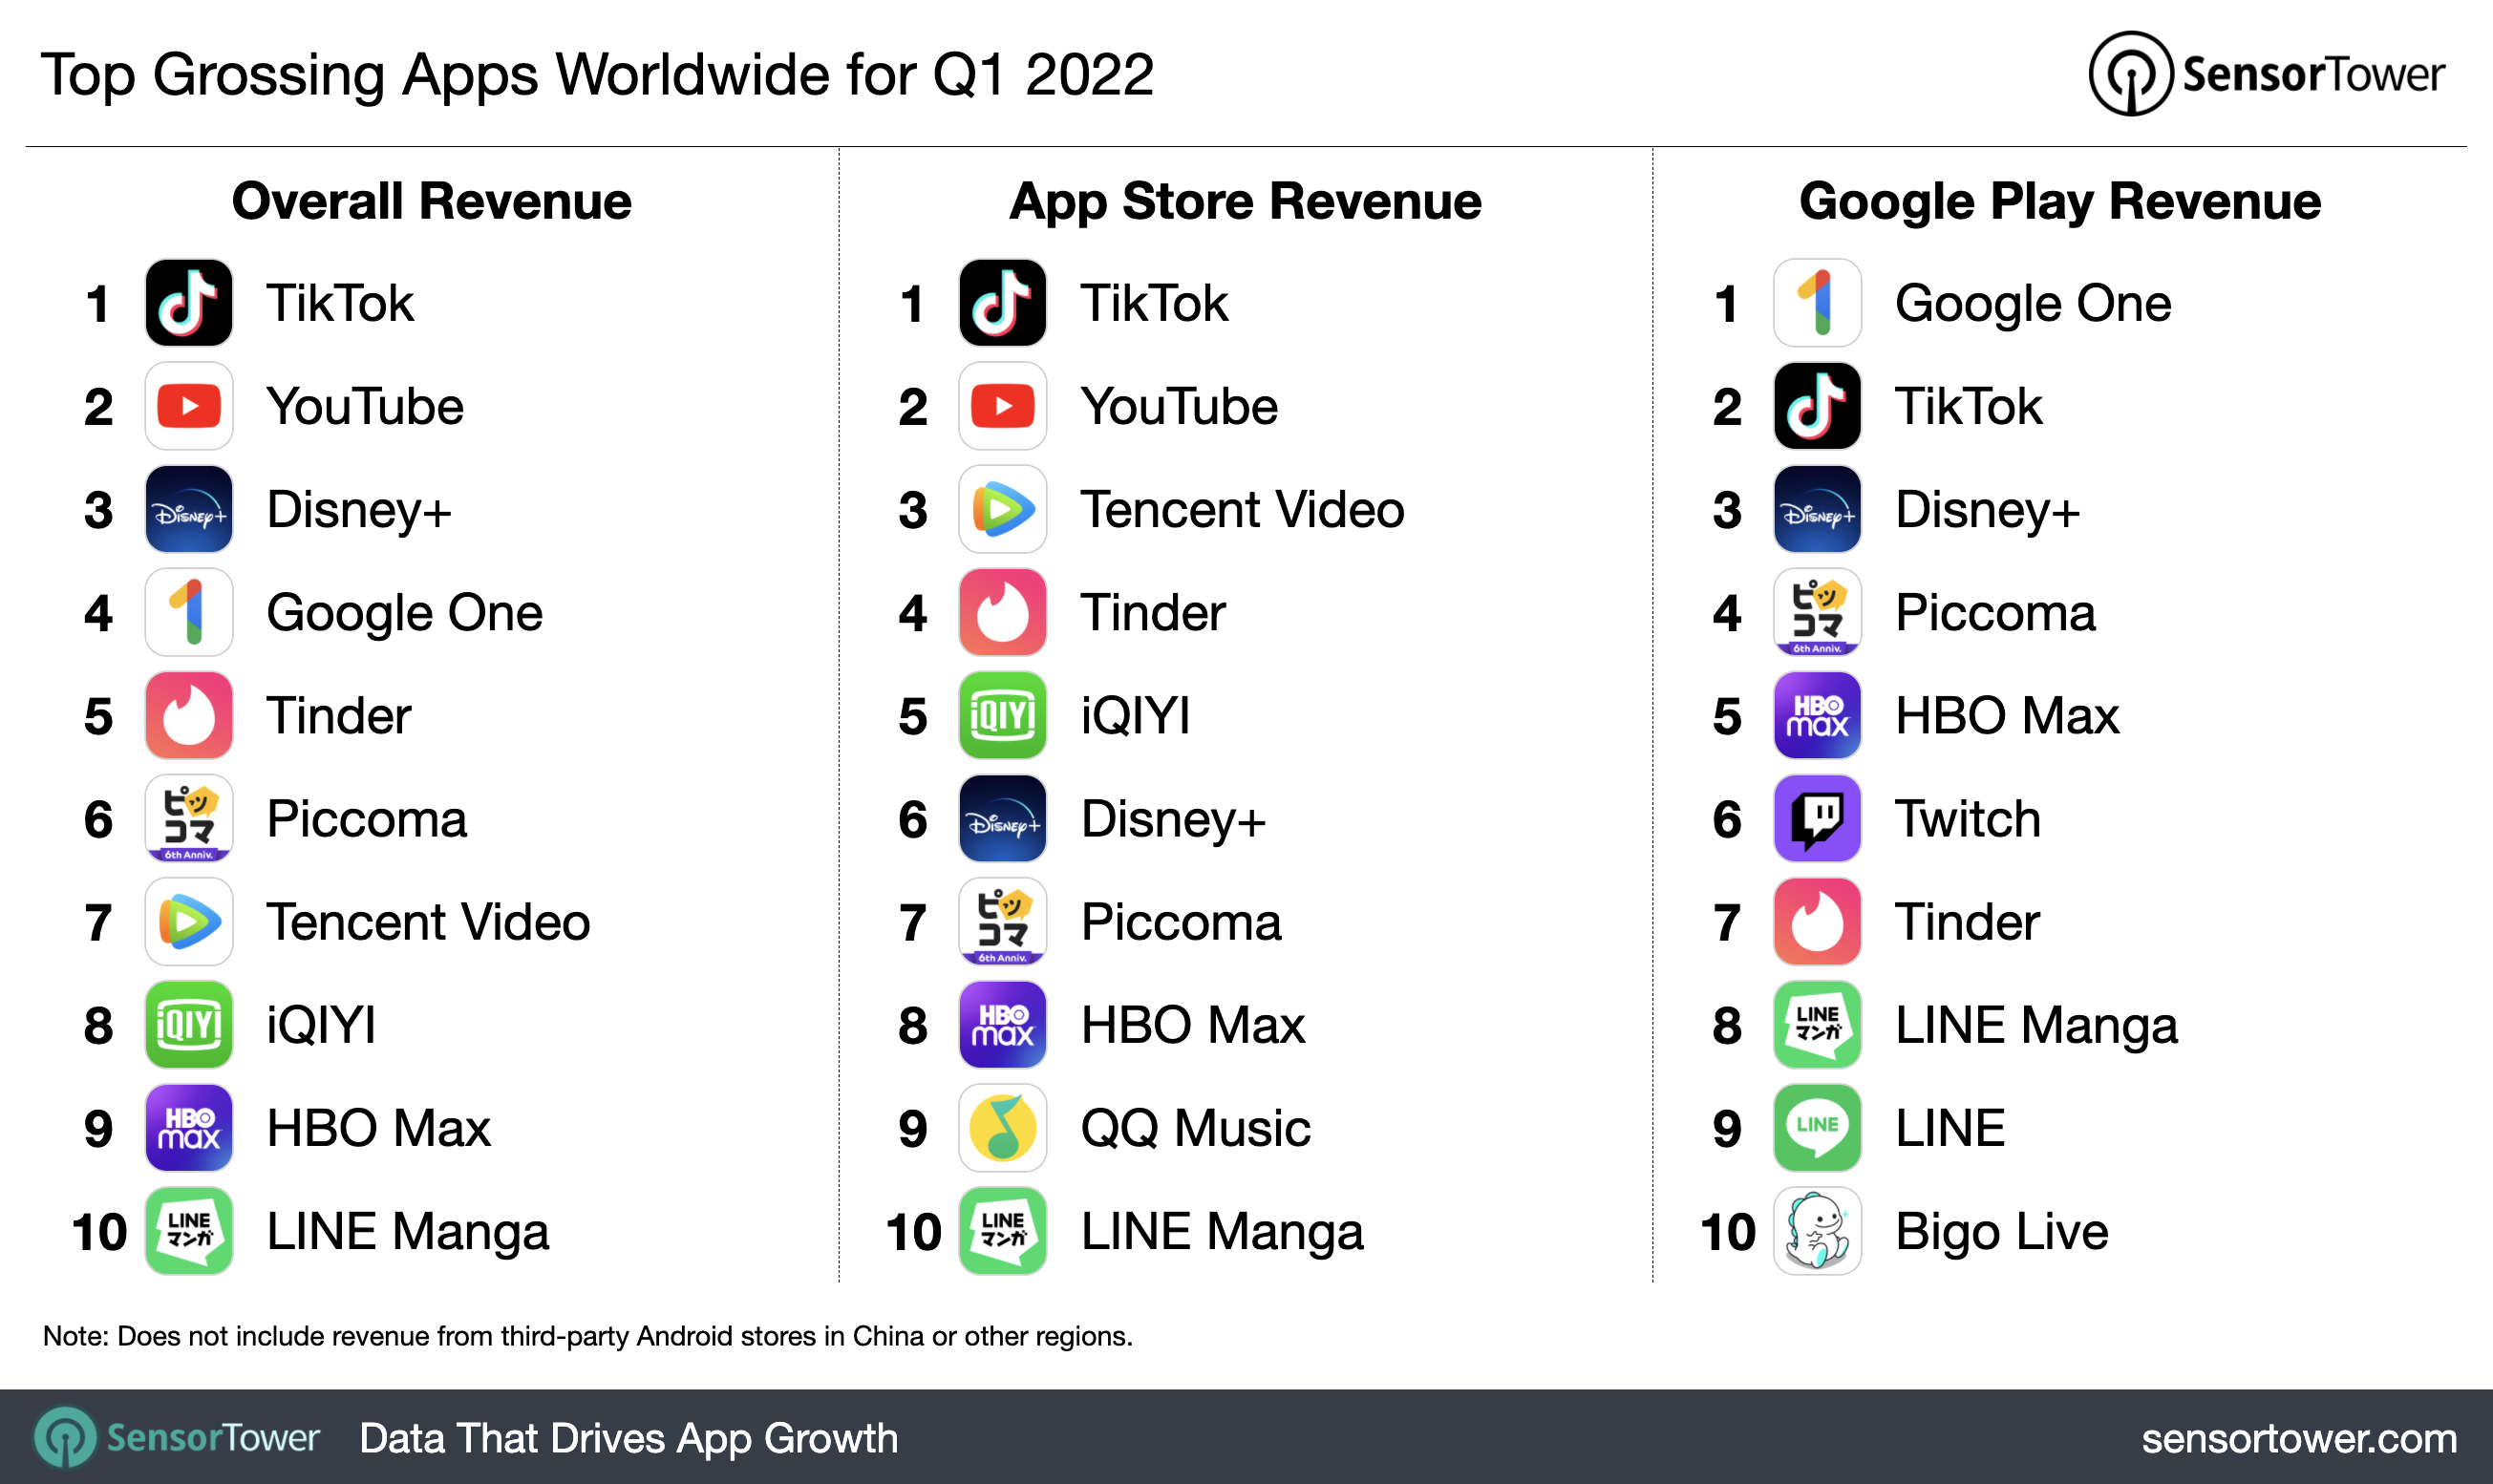
TikTok, including Douyin on iOS in China, maintained its position as the top grossing non-game app overall as well as on the App Store. Across both stores, TikTok generated $821 million in consumer spending this quarter. On Google Play, it came second to Google One, which topped the chart with nearly $250 million.
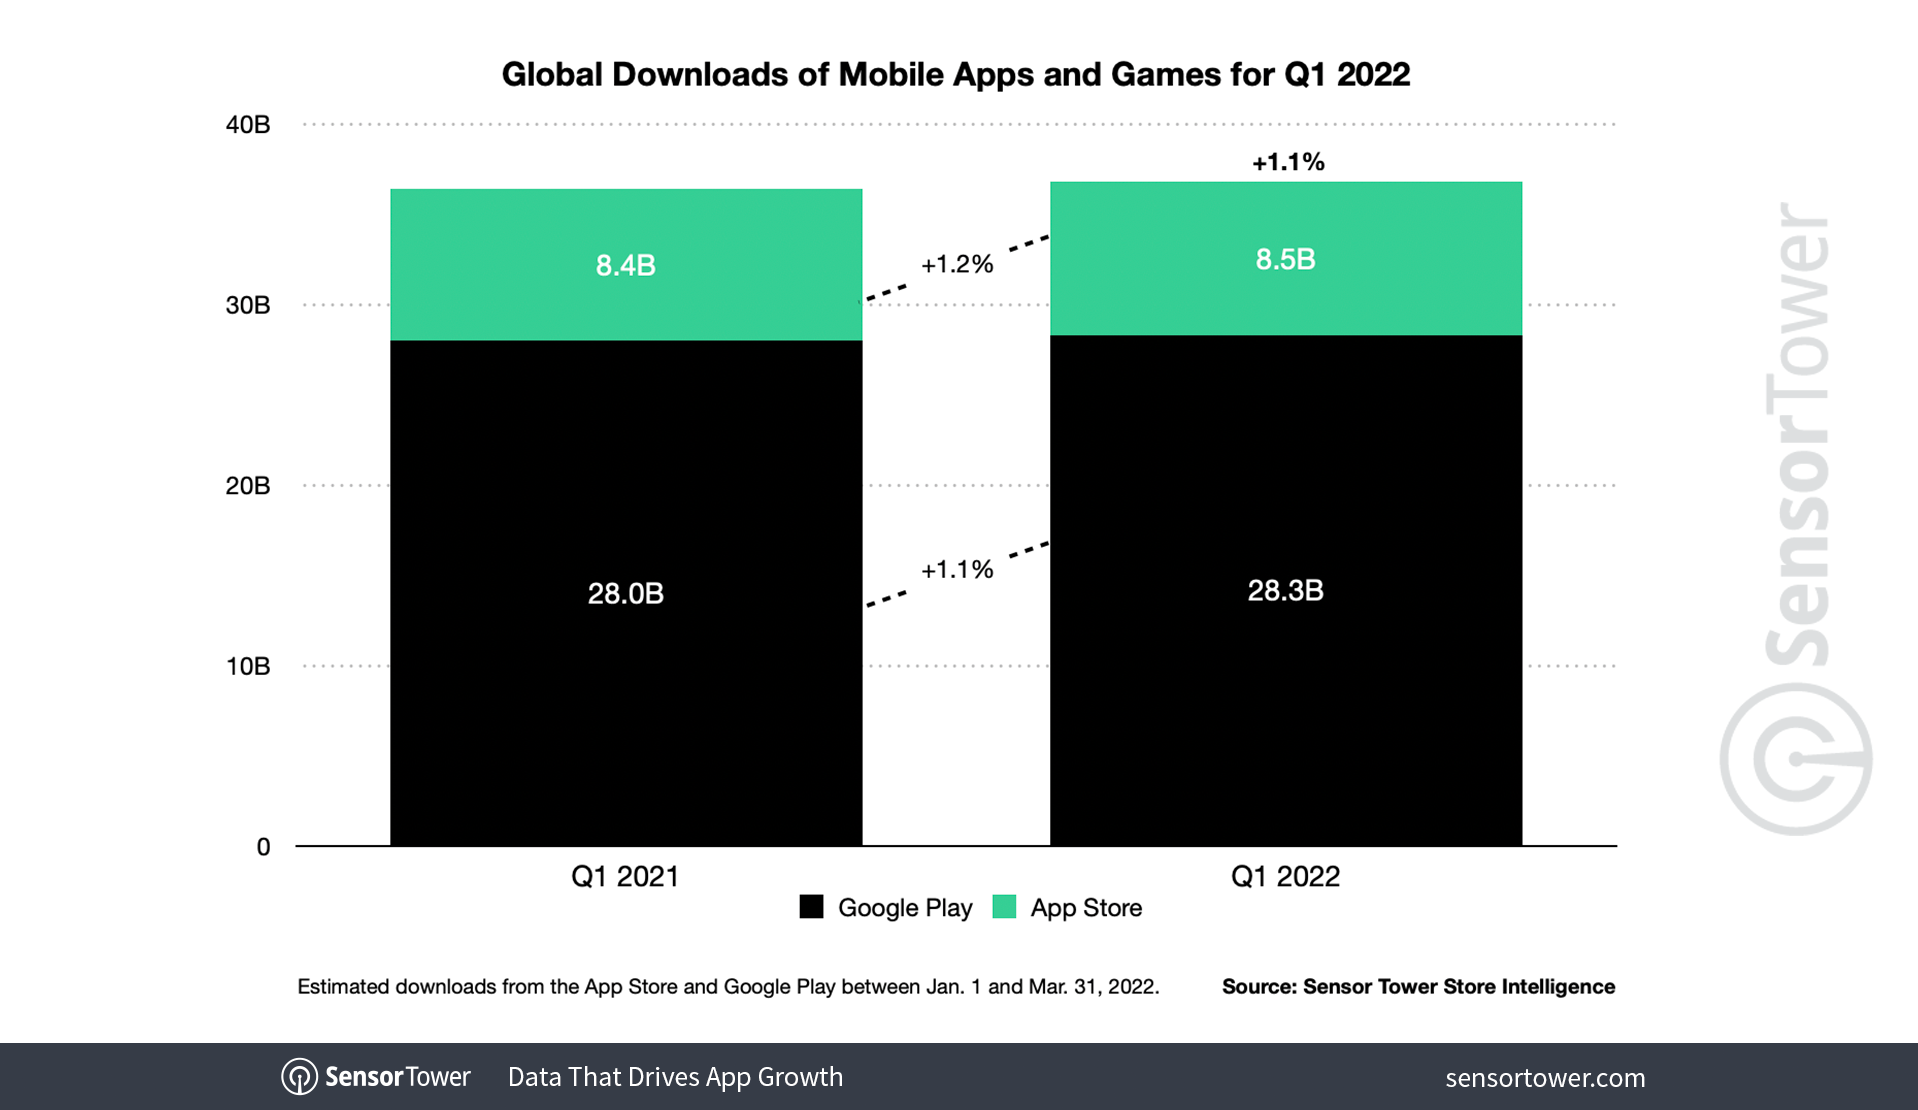
First-time downloads across the App Store and Google Play climbed 1.1 percent Y/Y in 1Q22, reaching 36.8 billion downloads. Both platforms saw approximately the same growth, with Apple’s marketplace rising 1.2 percent Y/Y to 8.5 billion downloads and Google’s store growing 1.1 percent Y/Y to 28.3 billion.
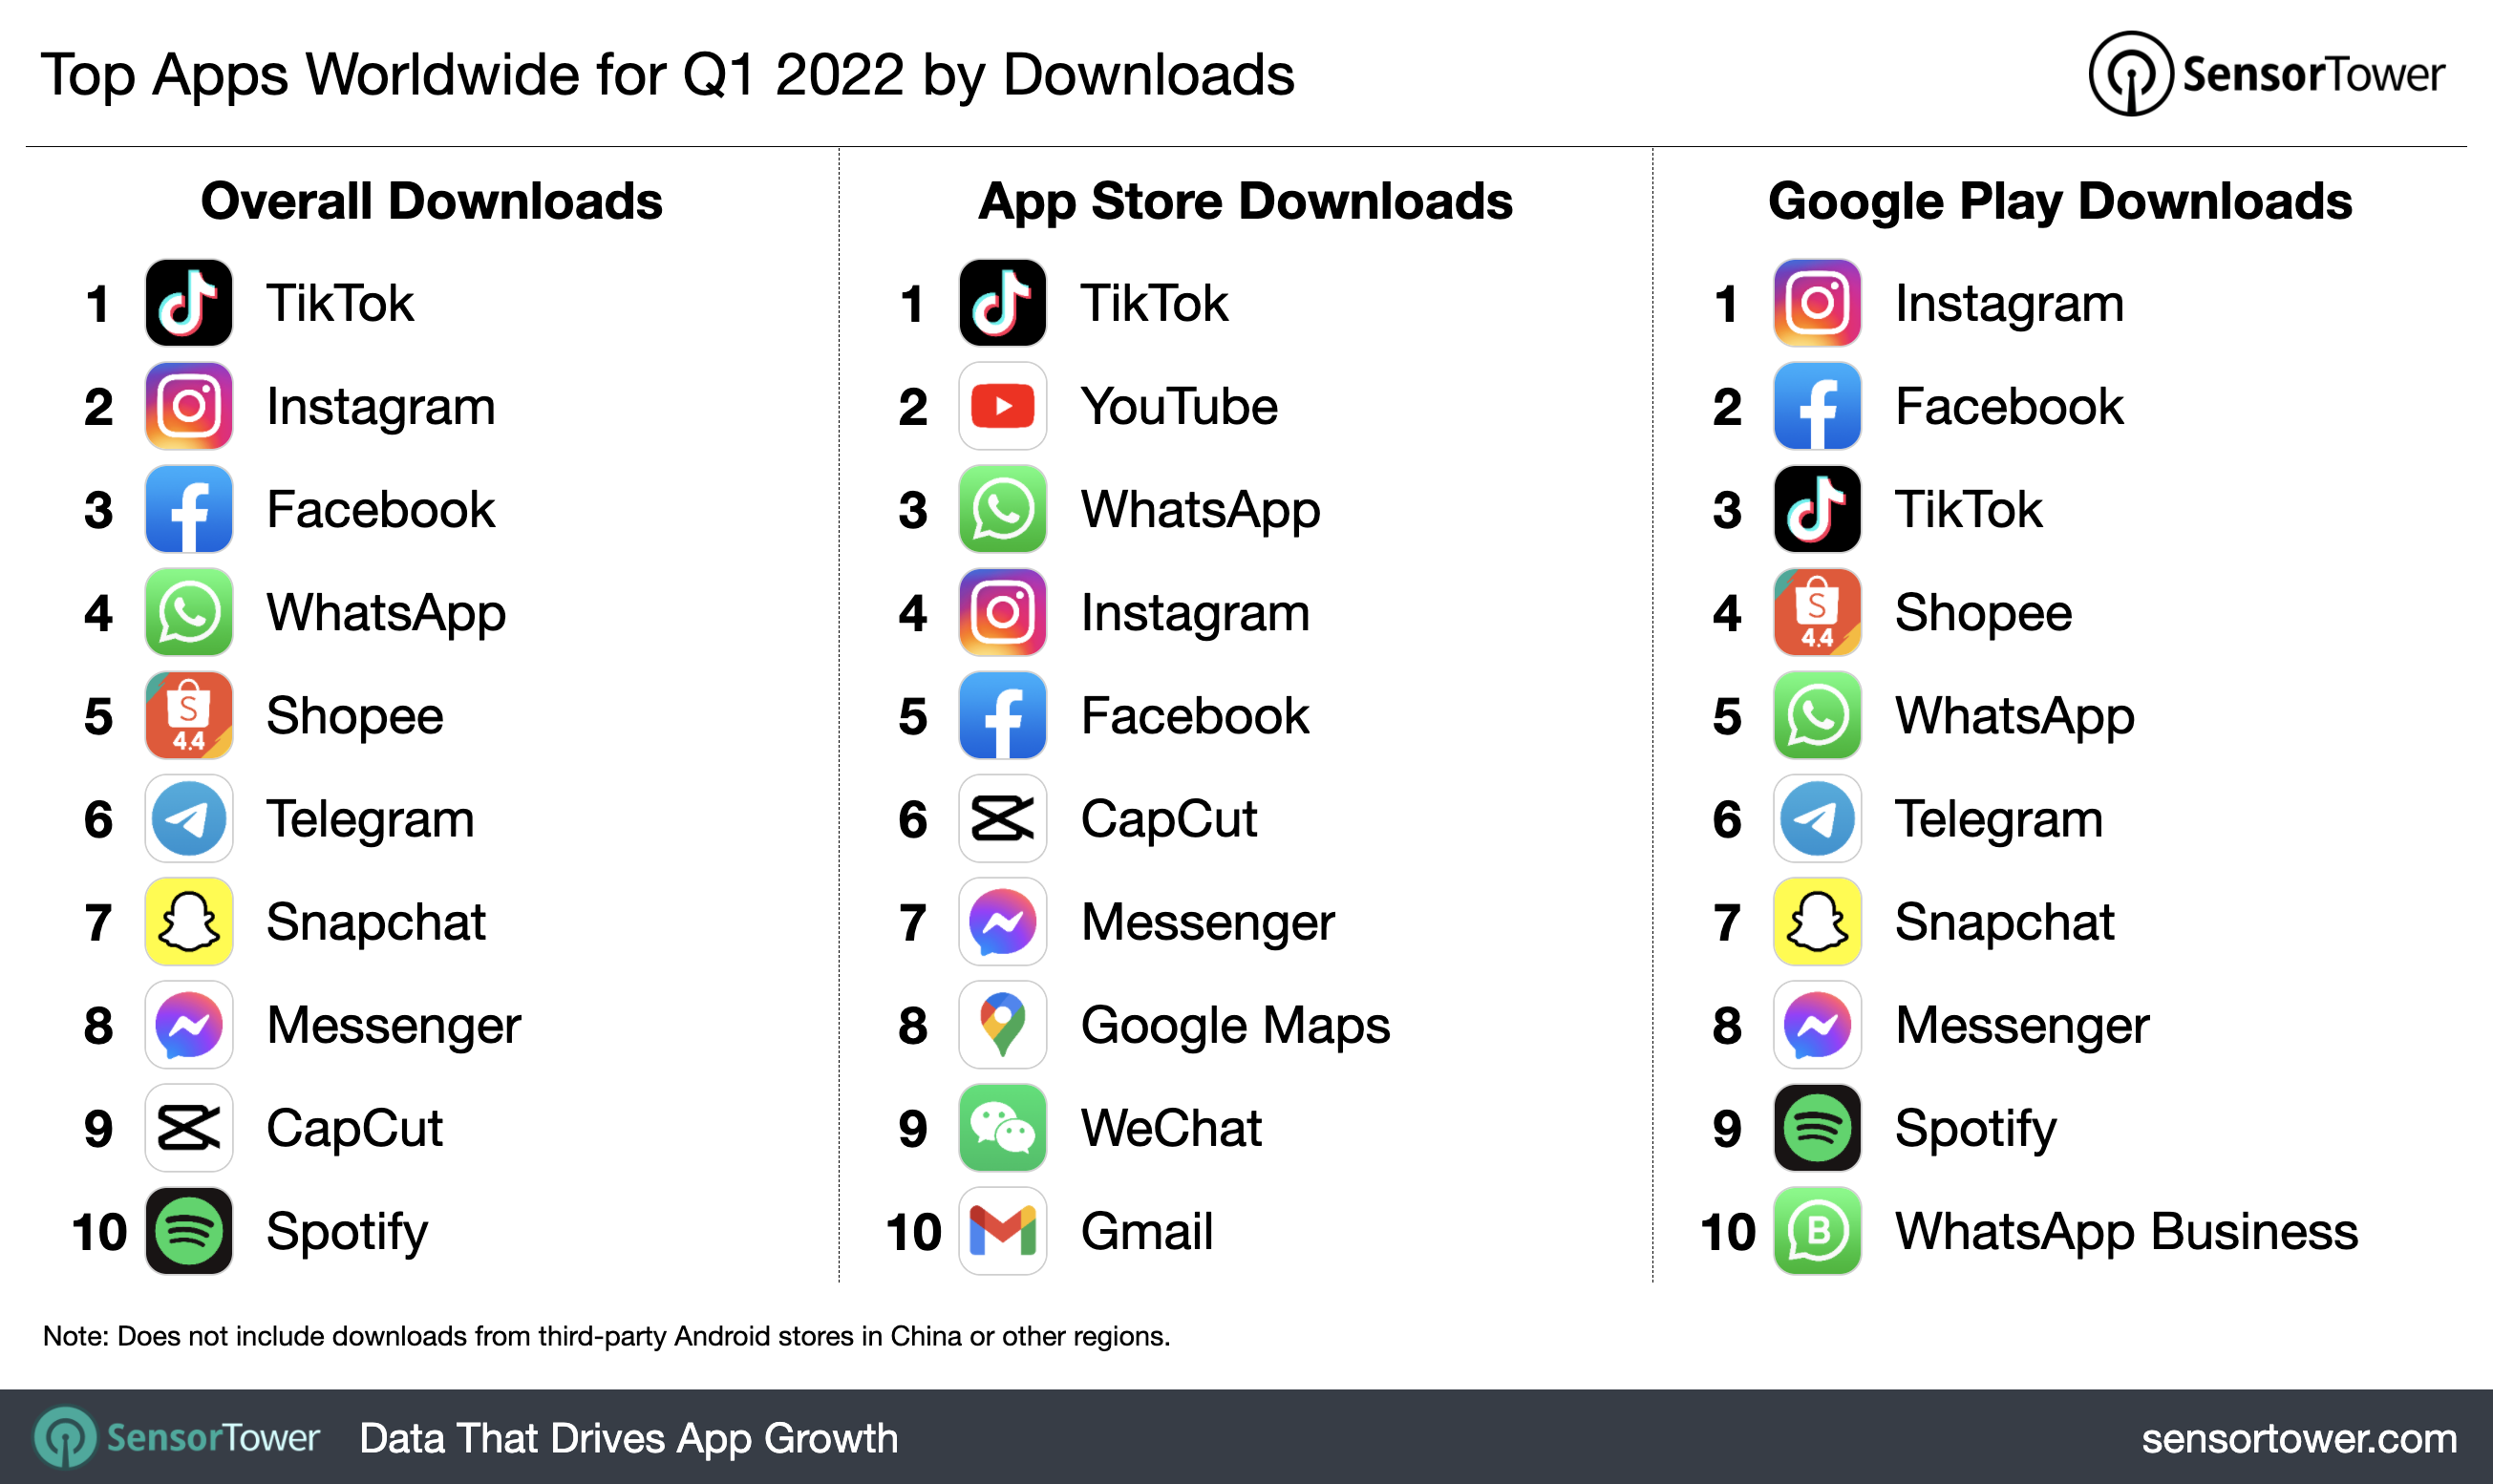
TikTok saw the most downloads across both marketplaces combined as well as on Apple’s platform, while Meta maintained its grasp on the top of the Google Play chart. In 2021, Facebook was the most downloaded app on Google Play, while this past quarter, that distinction went to Instagram, which saw 125.8 million first-time installs. Across the App Store and Google Play, TikTok saw more than 186 million installs globally.
Worldwide Mobile Game Revenue and Downloads
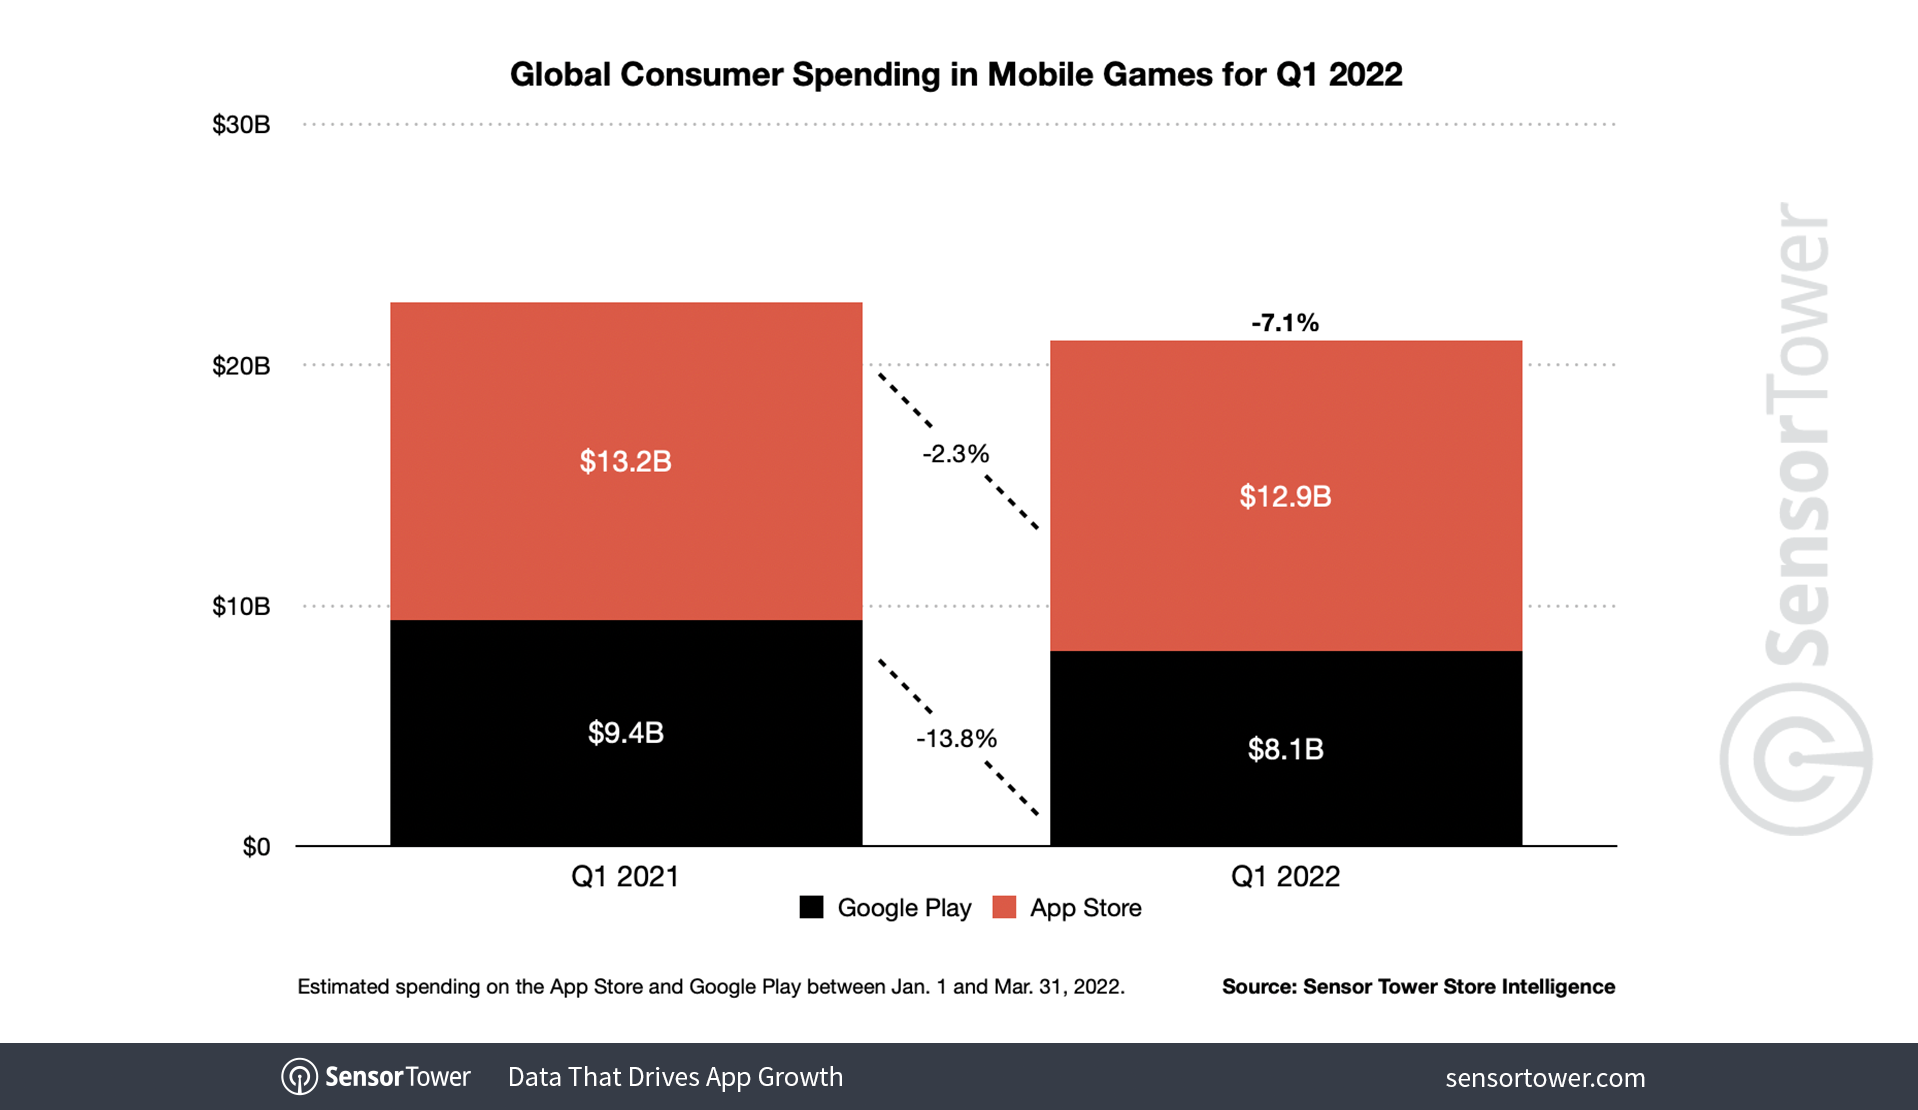
Consumer spending in mobile games declined 7.1 percent Y/Y to $21 billion in 1Q22, with both the App Store and Google Play seeing less revenue when compared to the year-ago period. Mobile games on Apple’s platform saw about $12.9 billion, down 2.3 percent Y/Y, while Google Play saw its mobile game revenue decline 13.8 percent Y/Y to $8.1 billion.
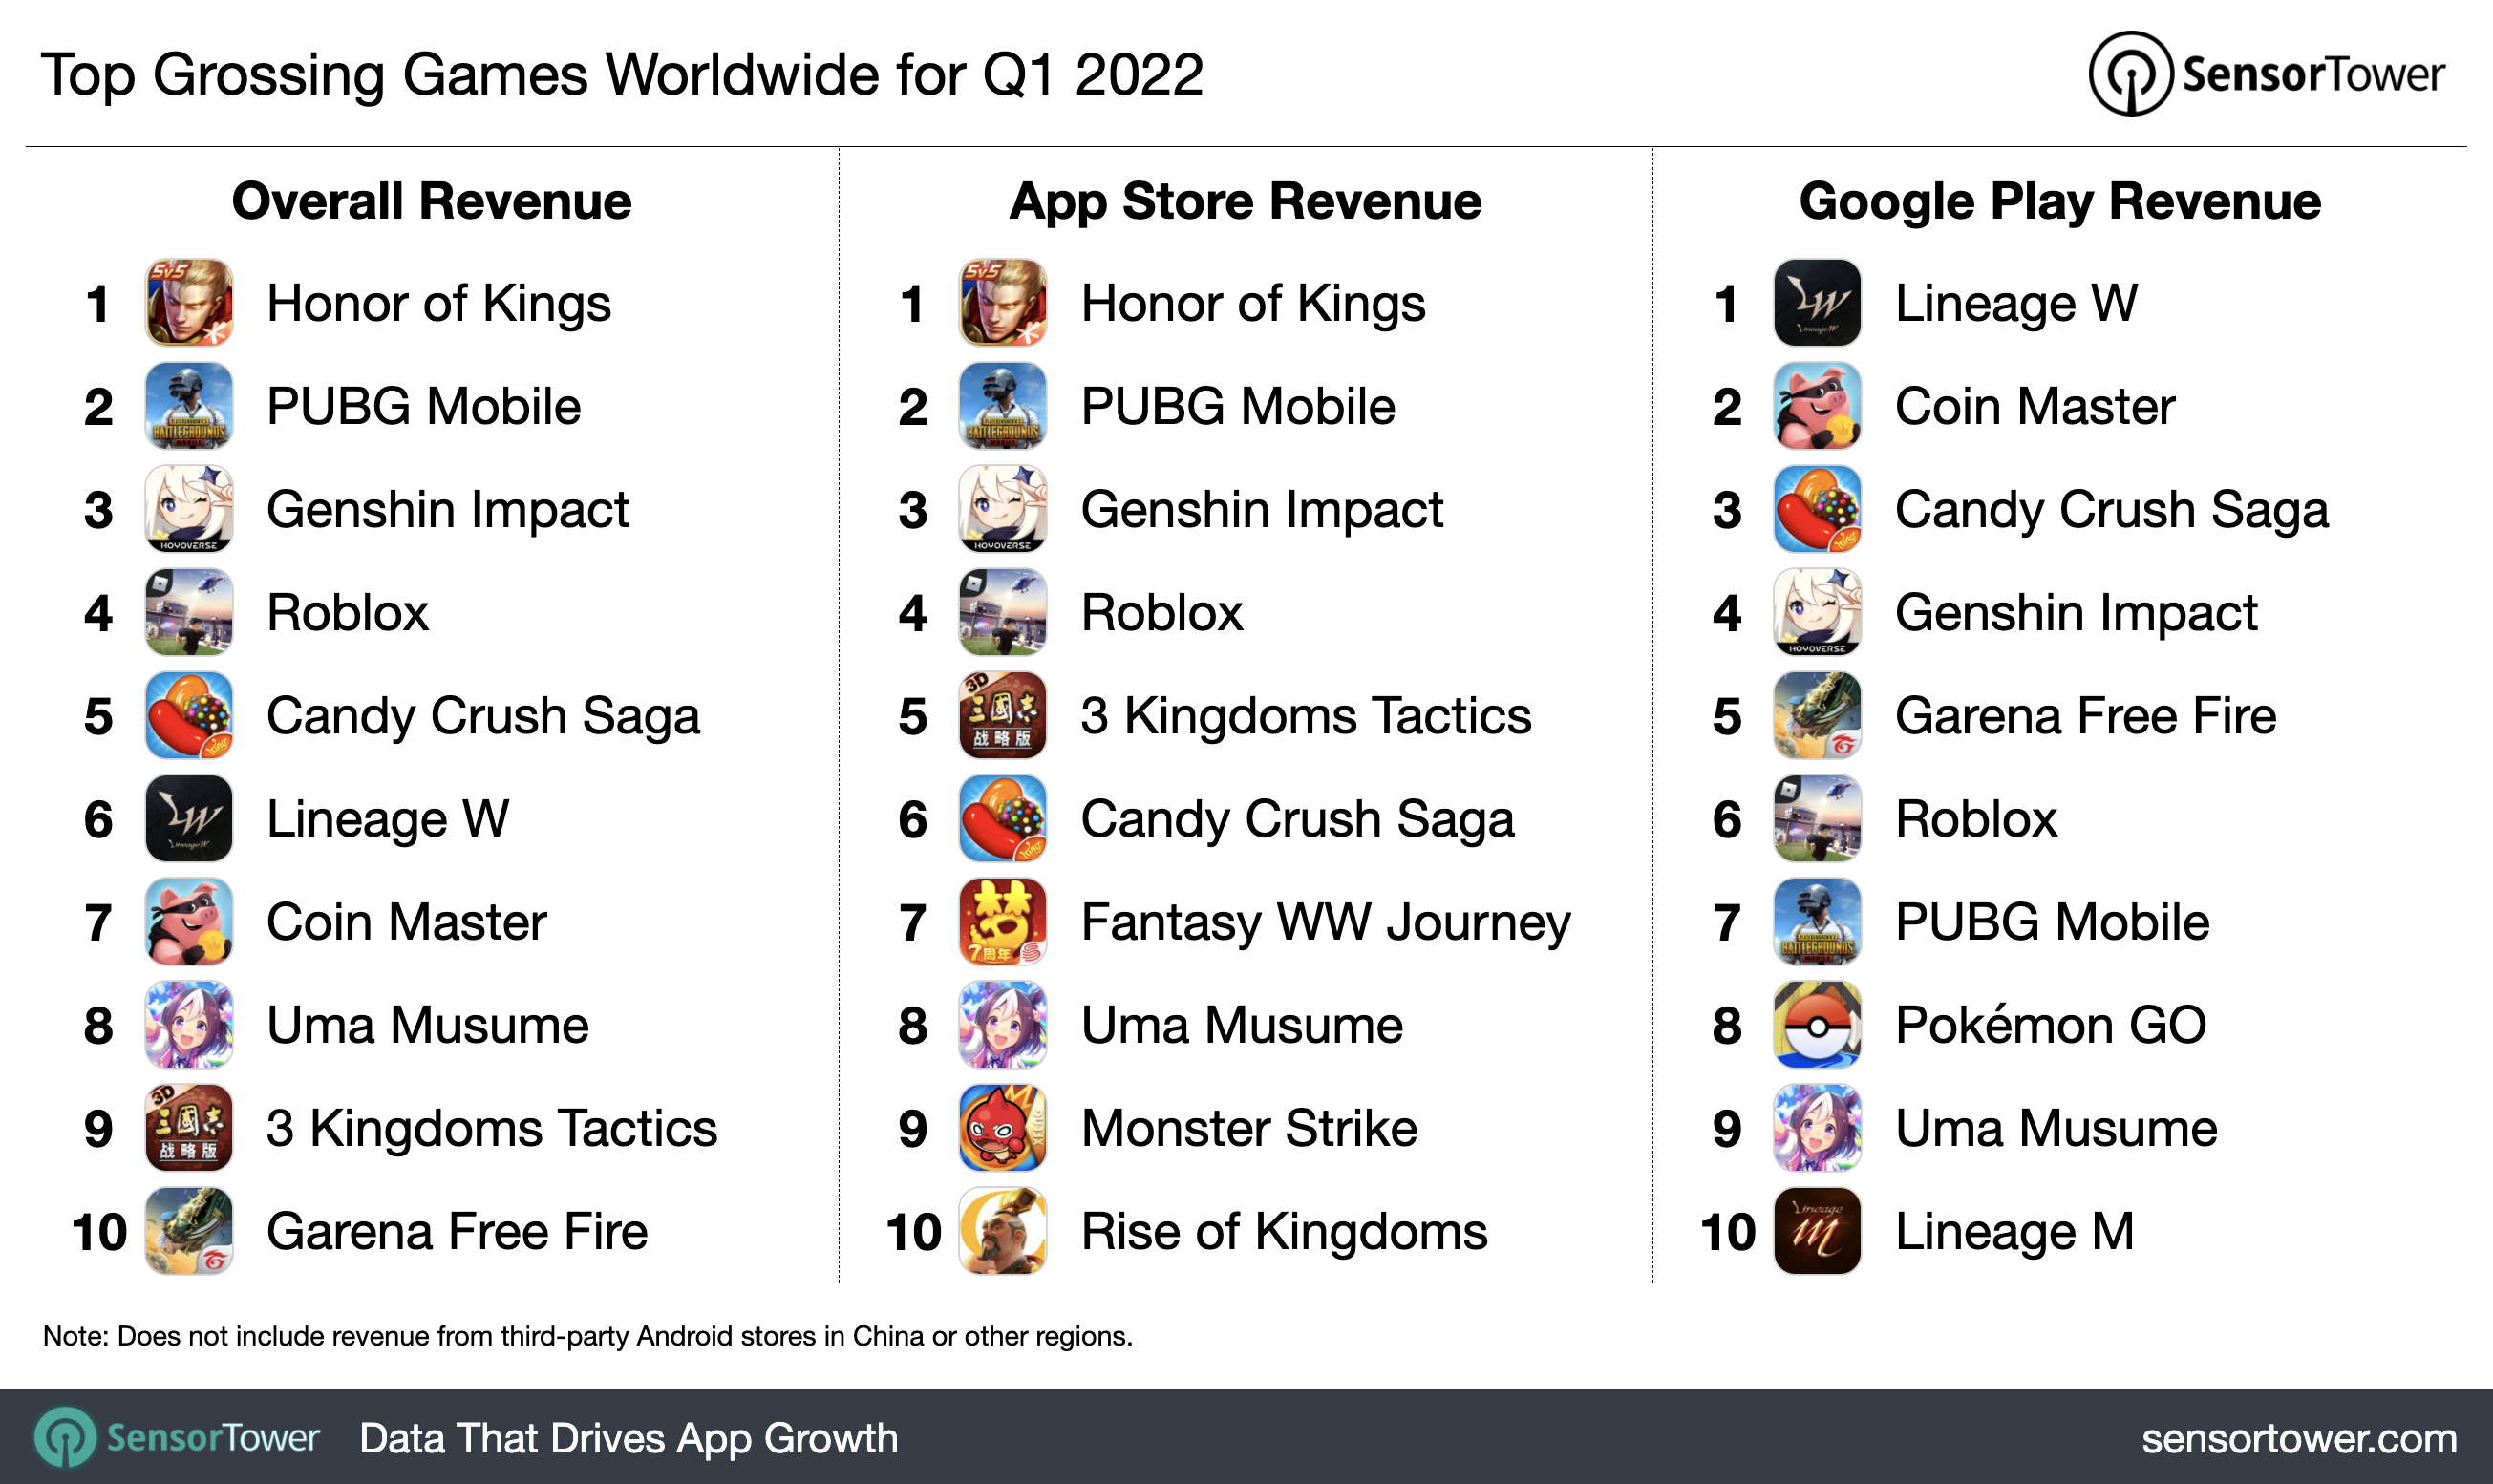
The top three highest grossing mobile games overall as well as on the App Store all came from Chinese publishers this quarter. Tencent’s Honor of Kings and PUBG Mobile—including its Chinese localization Game for Peace—came in No. 1 and No. 2 with $735.4 million and $643 million generated across both stores. MiHoYo’s Genshin Impact came in third with $551 million in player spending.
On Google Play, NCSoft’s Lineage W was the top earner, followed by Moon Active’s Coin Master and King’s Candy Crush Saga.
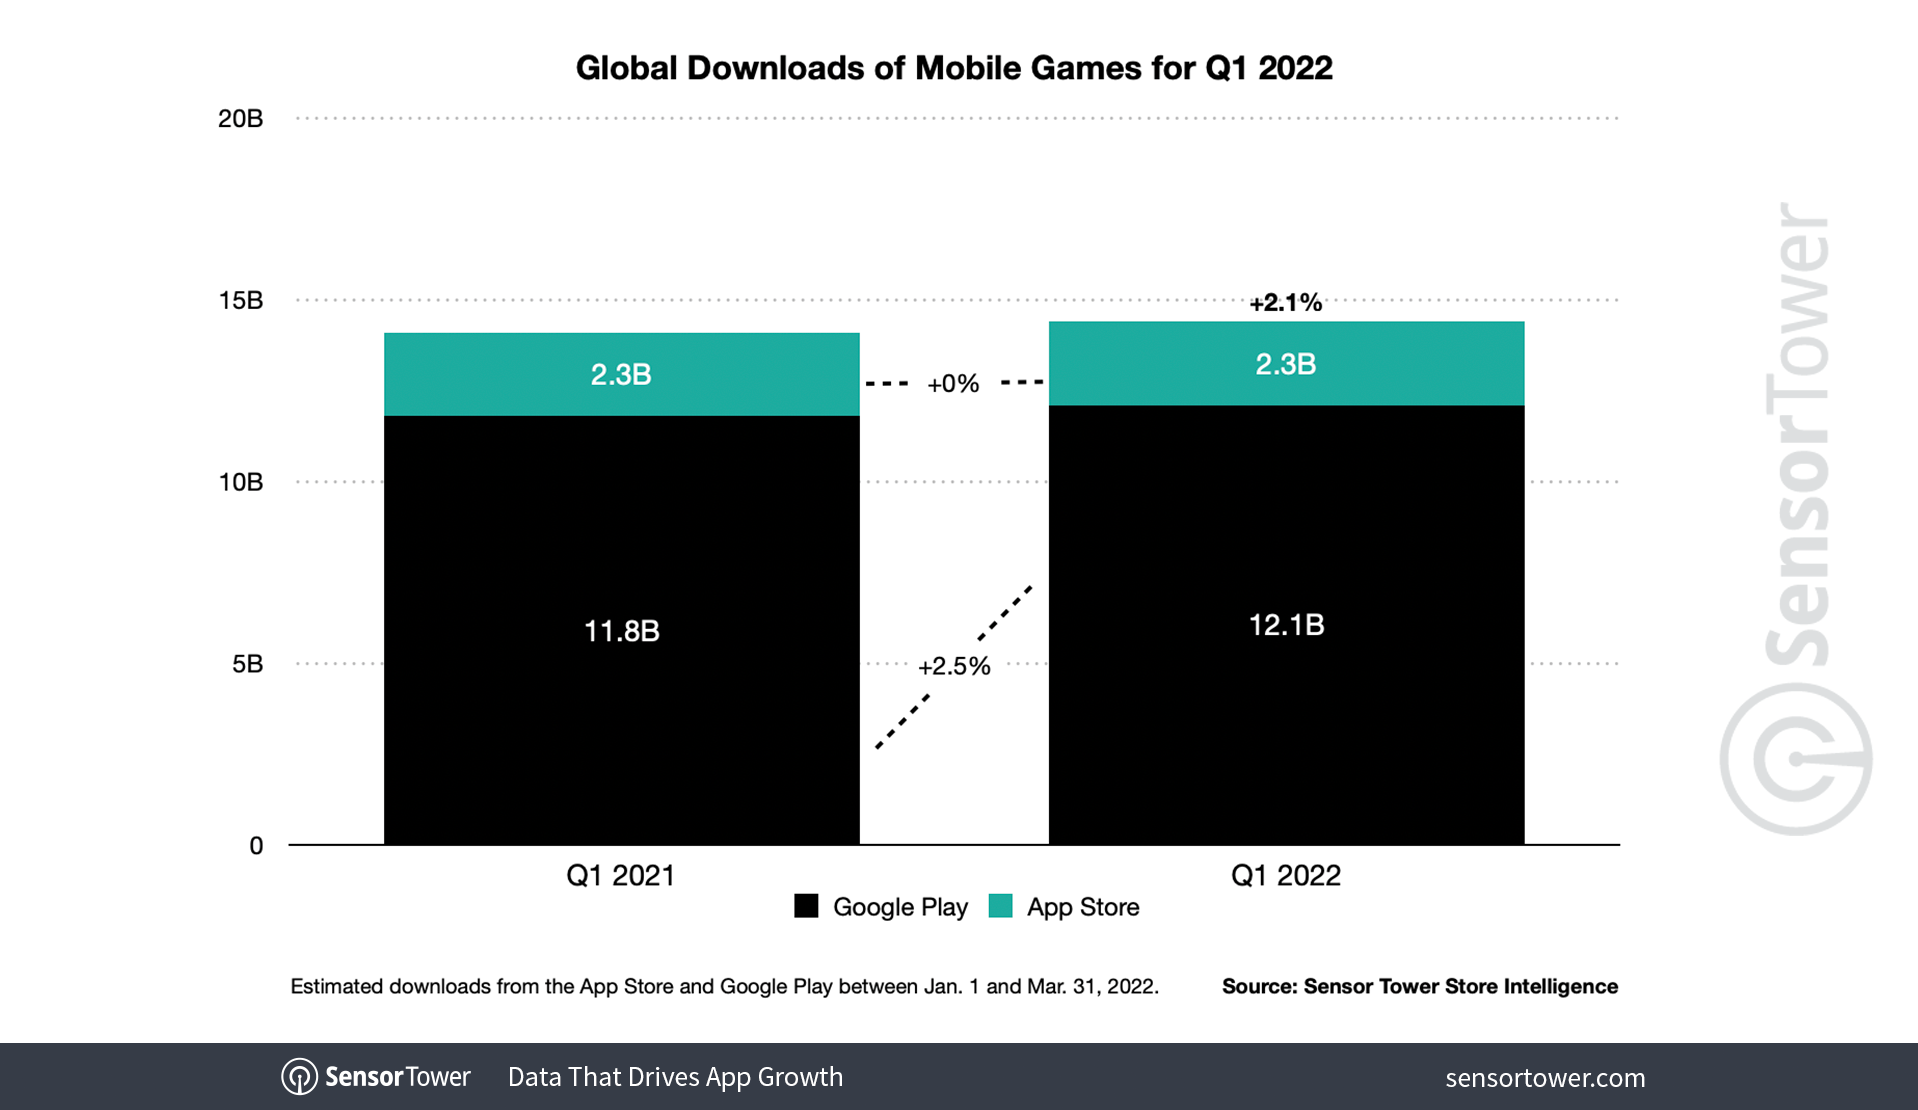
Worldwide downloads of mobile games grew 2.1 percent Y/Y in 1Q22, climbing to 14.4 billion. This was driven mainly by Google Play, which grew 2.5 percent Y/Y to 12.1 billion first-time downloads this quarter. App Store game installs remained flat Y/Y, holding at 2.3 billion.
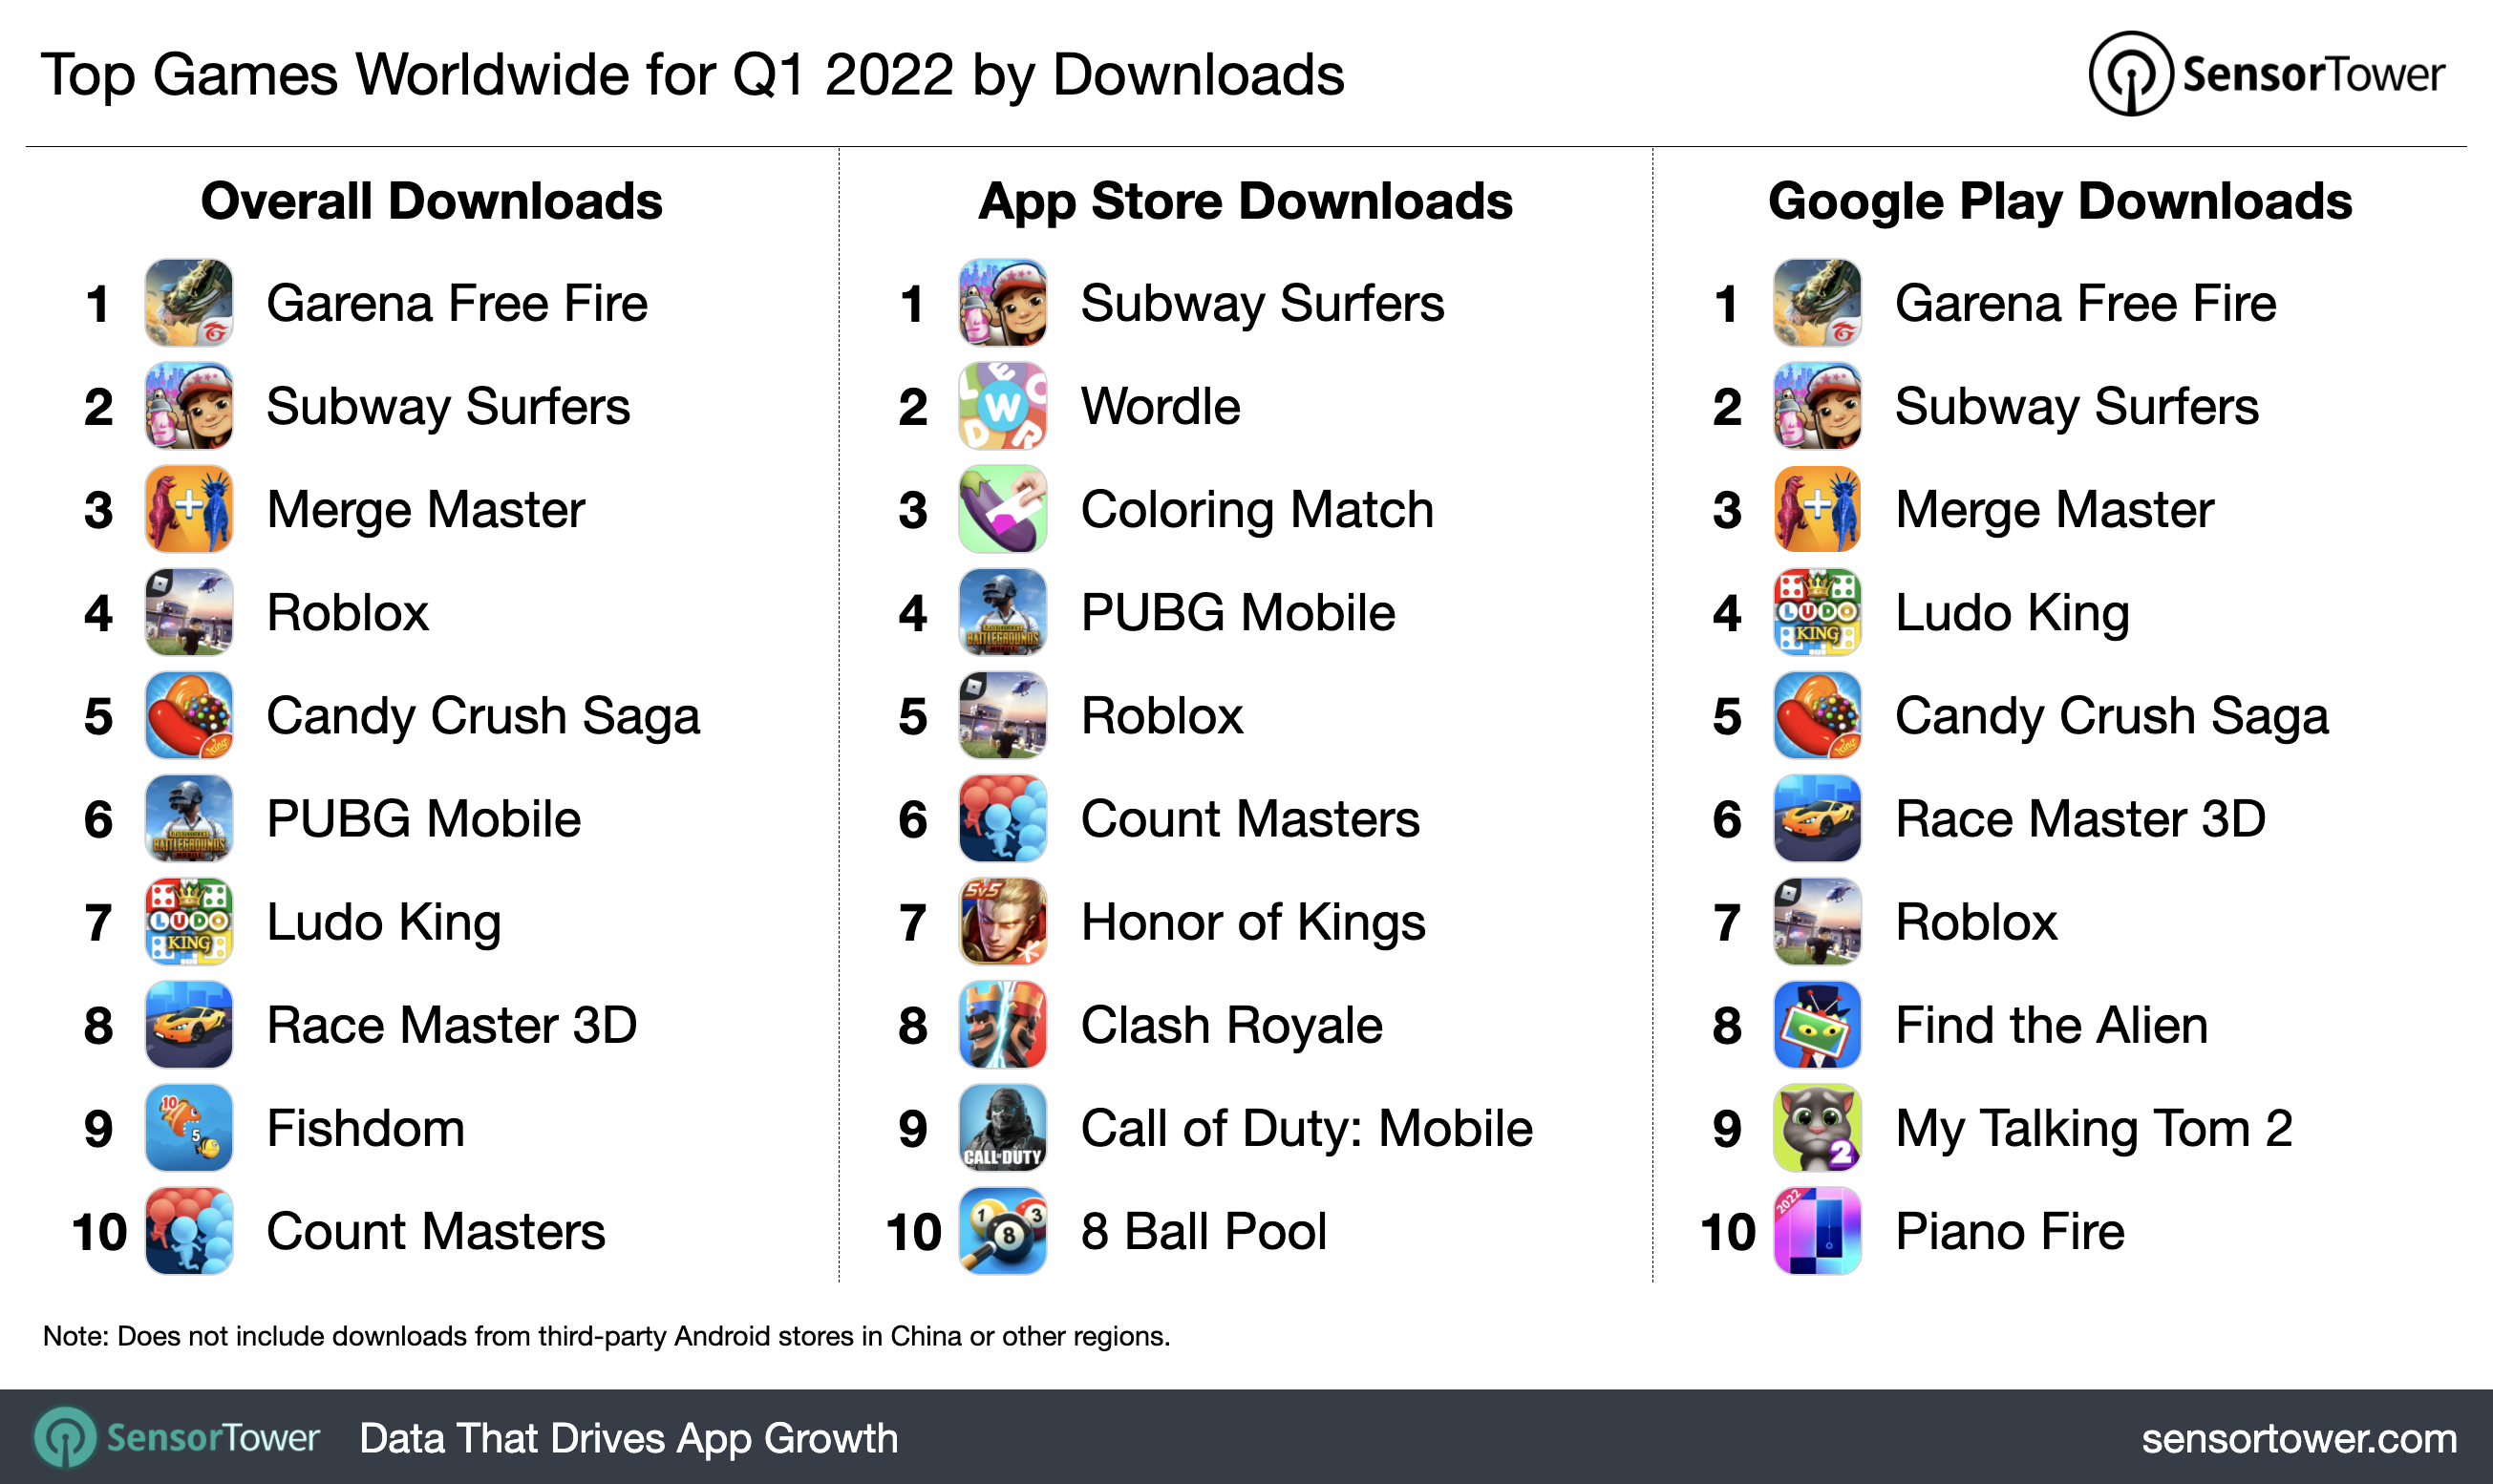
Garena’s massively popular battle royale title Garena Free Fire saw the most downloads across the App Store and Google Play as well as on Google’s marketplace, with 71.2 million installs across both platforms. It was followed by Sybo Games’ Subway Surfers, which saw 66.4 million installs across both stores and also topped the App Store chart. The third most downloaded title overall was Homa Games’ Merge Master - Dinosaur Fusion, which reached 49.4 million installs.
Although it wasn’t Josh Wardle’s viral version of the game, Goldfinch Studios’ Wordle! still managed to snag the No. 2 spot on Apple’s App Store with 13.8 million installs.
Gaming’s Digital Ad Spend Grew 41 Percent Y/Y
Leveraging Sensor Tower’s Pathmatics product, which tracks digital advertising on desktop and mobile display, desktop and mobile video, Facebook, Instagram, and Twitter, we also took a look to see where brands were spending marketing dollars outside of mobile apps. The top five advertisers in the United States spent approximately $786.7 million from January 1 through March 28, 2022, up 13.6 percent Y/Y from $692.3 million in the year-ago period.
The category that saw the most growth in digital advertising spend was Gaming—including console and PC platforms—which saw its brands spending 41 percent more on digital marketing campaigns across the platforms supported by our Pathmatics product in 1Q22 compared to 1Q21. It was followed by Pets, which saw 40 percent Y/Y growth, and Political, which grew 35 percent Y/Y. The top five categories that saw the most Y/Y growth in spending were rounded out by Travel & Tourism and Retail, which saw 32 percent and 31 percent growth, respectively.
The uptick in spending by the top advertisers is at least partially tied to an increased appetite for retail as the country has opened up after the vaccine rollout in 2021.
Mobile Market Growth Normalizes
Compared to the double digit percentage growth experienced by both stores in 2021, spending growth slowed in the first quarter of 2022. This represents a normalization in the market following supercharged growth during the onset of COVID-19, as well as slowed spending possibly due to factors such as a rising cost of living. However, the categories that saw a boost due to COVID-19 have continued to see their usage climb Y/Y. Our in-depth analysis of the mobile app ecosystem and its continuing trends in 1Q22 will come soon, including additional insights into 2022's top apps, games, and publishers.
Note: The revenue estimates contained in this report are not inclusive of local taxes, in-app advertising, or in-app user spending on mobile commerce, e.g., purchases via the Amazon app, rides via the Lyft app, or food deliveries via the DoorDash app. Refunds are also not reflected in the provided figures.
