2026 State of Mobile is Live!
Mobile App Insights · Ruika Lin · June 2017
U.S. Android Users Spent an Average of $30 on Google Play Apps in 2016
Sensor Tower Store Intelligence found that American consumers spent about $17 less on Google Play in 2016 versus iPhone user spending on the App Store.

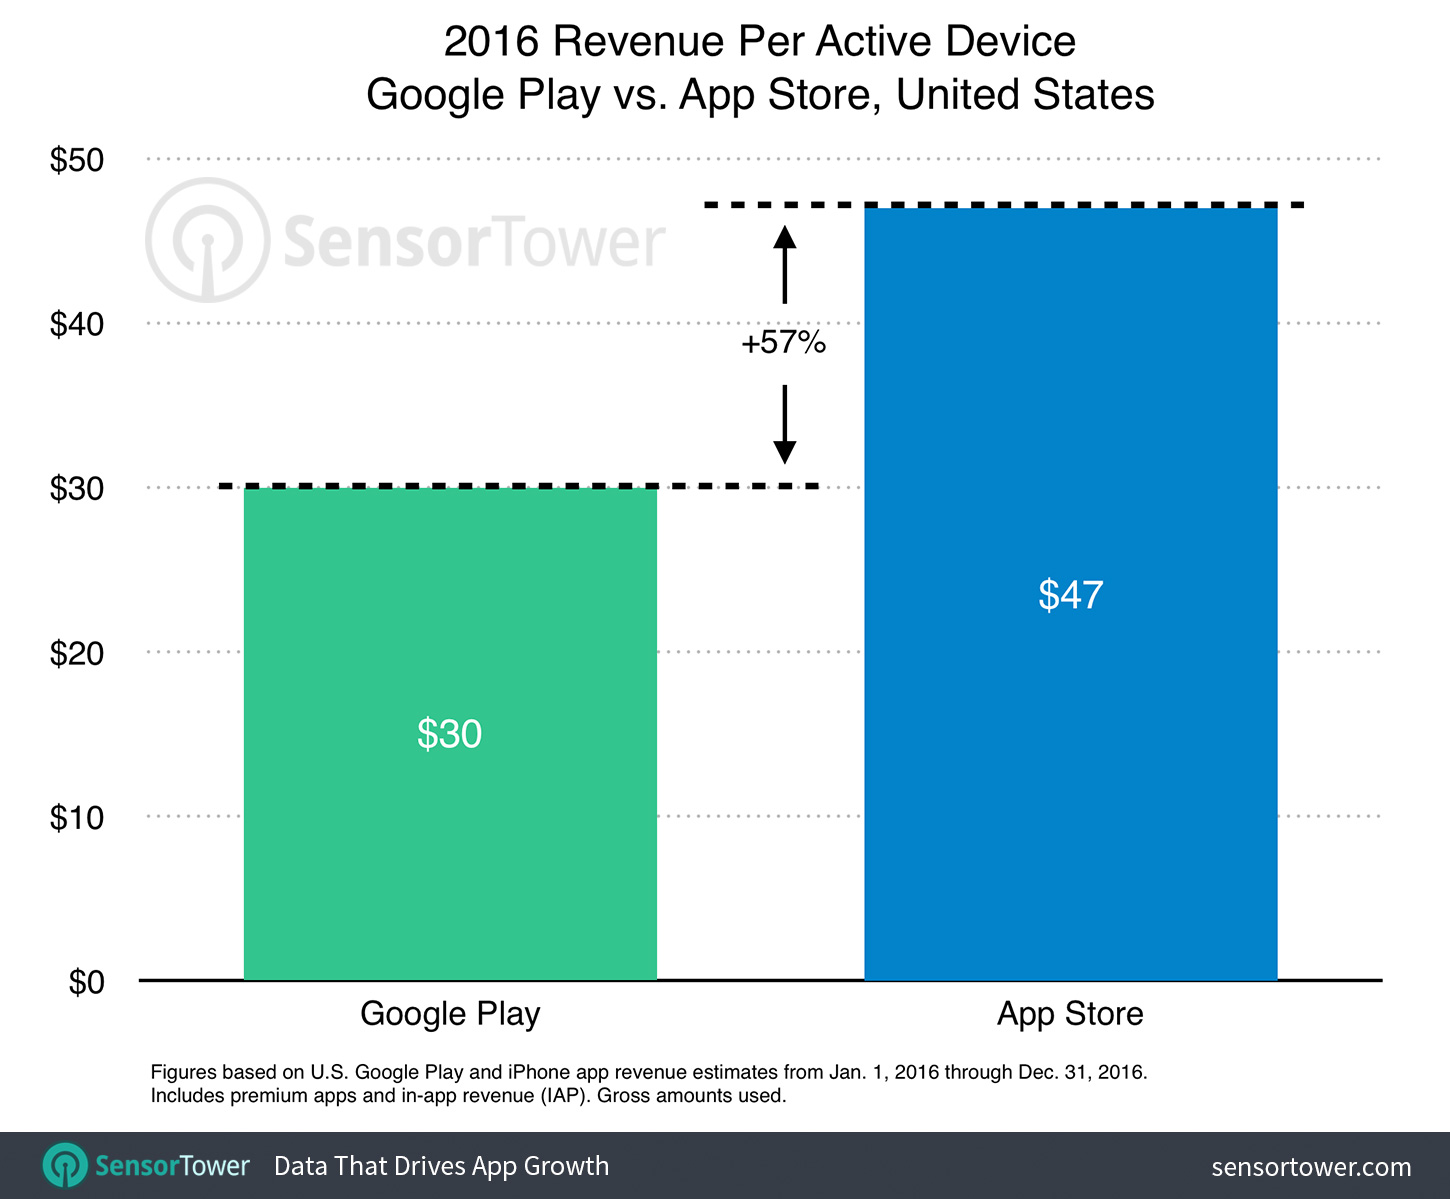
Android users spent an average of $30 per device on Google Play apps in the United States last year, Sensor Tower Store Intelligence data reveals. By comparison, our recent research into per-device spending on iOS found that U.S. iPhone users spent an average of $47 on apps per active device in 2016, or 57 percent more than their Android counterparts.
In this report, we'll examine the leading categories of Google Play apps by per-device spending last year on an estimated 135 million active Android smartphones and tablets in the U.S. for 2016 with default access to the Play store. This estimate excludes the Amazon Fire and other Android-based tablets that do not ship with Google Play installed.
Average Revenue Per Active Android Device

As the chart above illustrates, U.S. Android users spent approximately $17 less per device on Google Play than iPhone users did on the App Store last year. This is in line with a greater trend we've identified regarding the difference in in-app spending between the two stores, and the fact that Apple's App Store still maintains its leadership over Google Play in the U.S. when it comes to app monetization.
Mobile Games Led Android Consumer Spend
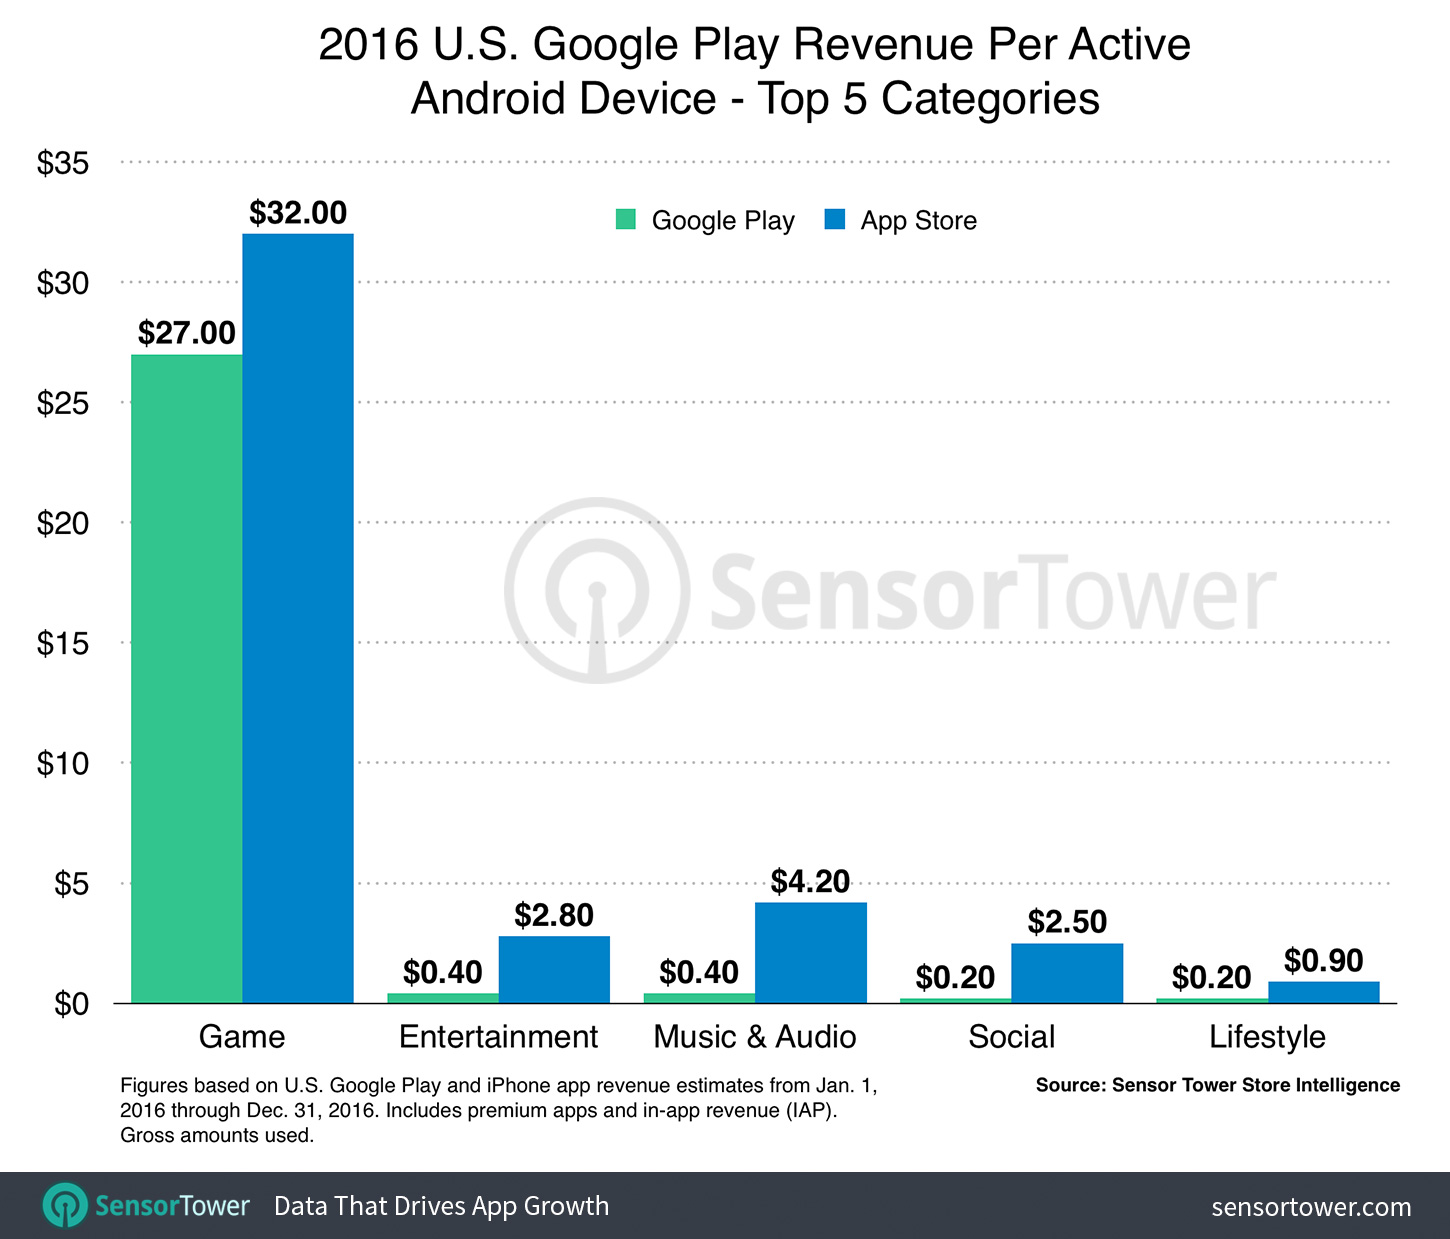
Not surprisingly, mobile games comprised the majority of per-device spending last year on Google Play. As the chart below highlights, Google Play users in the U.S. spent an average of approximately $27 per device on games during 2016.

Although this figure was less than iPhone users' per-device spend on games last year, it made up an overwhelming 90 percent of the $30 spent per device on Google Play in 2016, as opposed to 68 percent of the $47 spent per-device by iPhone users on the App Store.
This means that, on average, Android users spent far less per device on non-game apps than their iPhone-owning counterparts did. And as the above chart indicates, all non-game categories on Google Play earned less than $0.50 of per-device revenue last year on average.
The second-highest earning Google Play category, Entertainment, accounted for an average of $0.40 per device, which was less than 15 percent of the $2.80 spent in this category per device by iPhone users. The gap was even wider for the Music category, with an average of $0.40 on Google Play, close to 10 percent of the $4.20 spent on the App Store.
Social and Lifestyle categories tied for fourth place, both with approximately $0.20 of per-device spend. iPhone users spent $2.50 and $0.90 on these two categories of apps, respectively.
Average App Installs Per Active Android Device
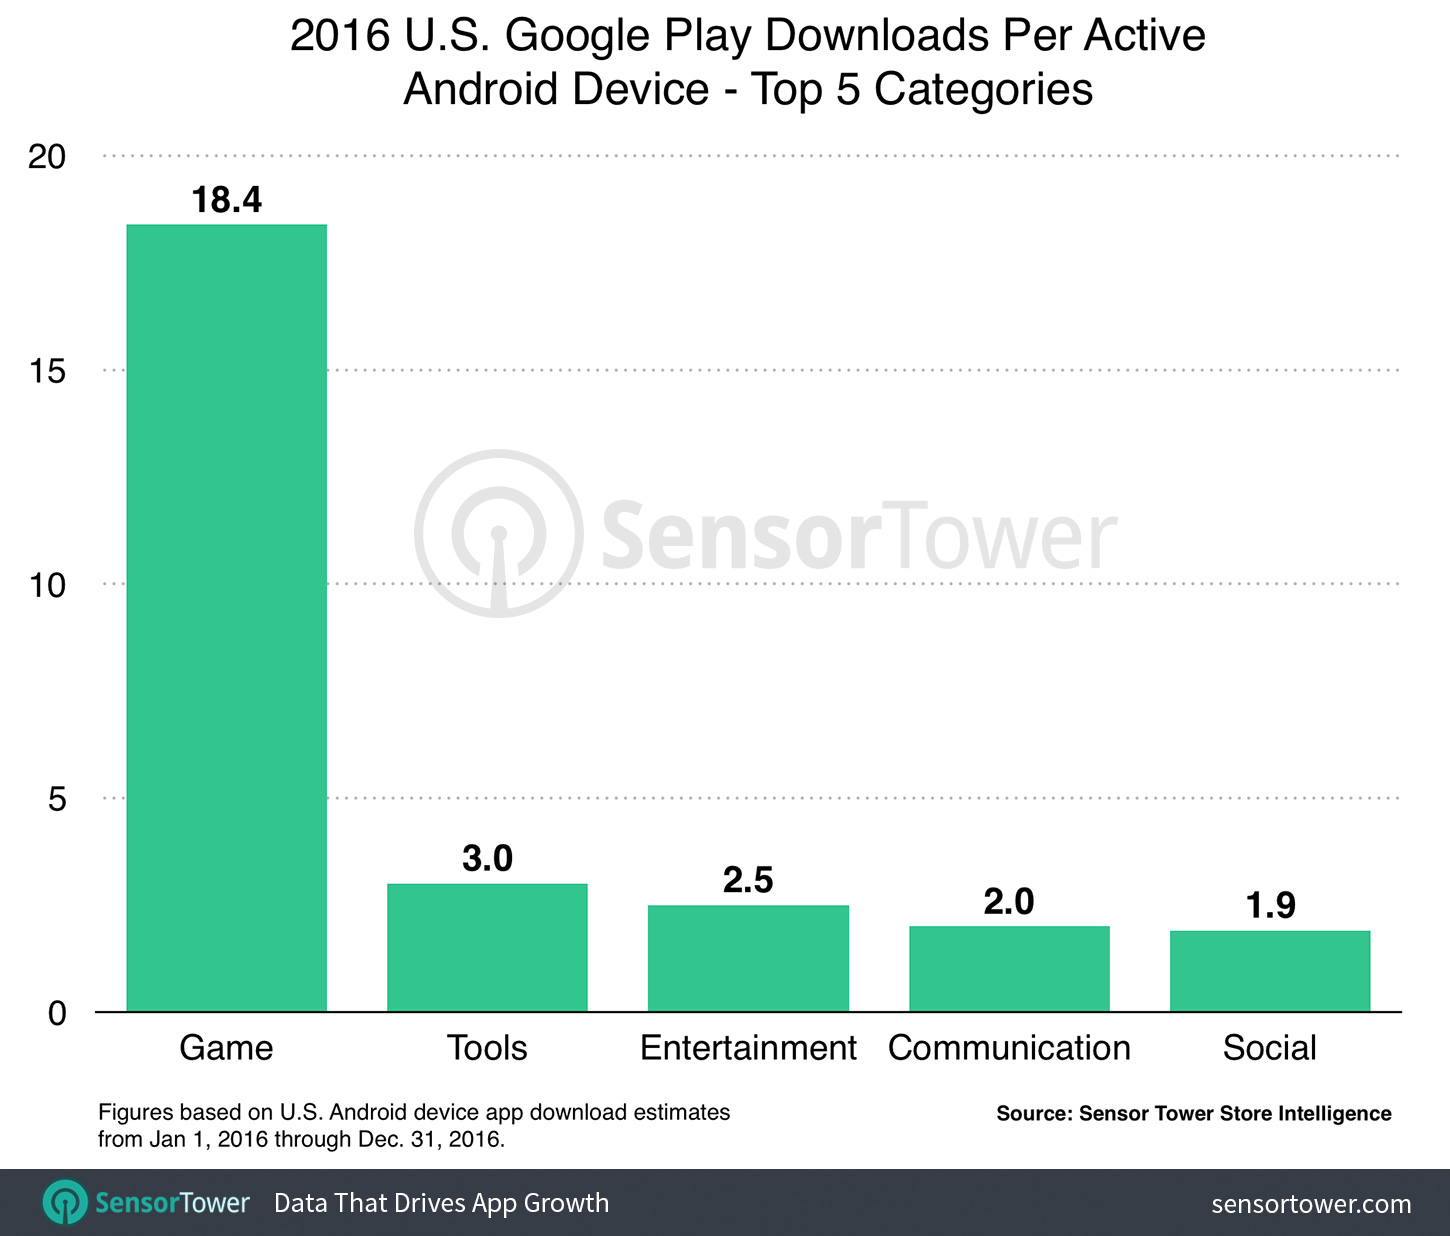
Looking at app installs, we found that the average number of apps downloaded per Android device was 42 last year in the U.S., compared to 41 per iPhone. Breaking this down by category, games dominated with an average of 18.4 downloads per device, as shown in the chart below.

This was about 513 percent more than the average number of installs for Tools, the second-place category on Google Play with three downloads per Android device, and approximately 50 percent more than on iPhone, where there were an average of 12.3 games downloaded per device last year.
This device-level data sheds light on the macro trend present in the divergent consumer behaviors on the two stores. As our analysis shows, Google Play users are downloading more apps on average, but spending less money on and in them relative to iPhone users. From a consumer preference perspective, this is not unexpected as Android devices are typically lower-priced than Apple's, and cost-conscious Android users are less likely to spend as much in mobile apps as iPhone owners.
In addition, different monetization policies on the two stores is another potential contributor to lower per-device revenue on Google Play. Unlike Apple, Google doesn't require publishers to use the Play store's in-app billing service. As a result, app publishers are able to bypass Google Play entirely for billing purposes and avoid paying Google its 30 percent platform fee.
Top-earning iOS apps such as Hulu and Spotify are among the ones that didn't monetize on Google Play last year. For Google as a business, this poses a potentially nontrivial amount of uncollected app revenue, especially from publishers that generate a significant amount of revenue for Apple via the App Store.
Note: This analysis has been revised since its original publication based on our latest model of active iPhone handsets in the U.S. for 2016. The revenue estimates displayed above are gross amounts spent by consumers on Google Play and the App Store before Google and Apple's 30 percent cut of revenue has been deducted, and are not inclusive of taxes.
